1. Understanding how VisIt works
1.1. VisIt’s Core Abstractions
VisIt’s interface is built around five core abstractions. These include:
Databases
Plots
Operators
Expressions
Queries
1.1.1. Databases
Databases read data from files and presents the data in the user interface as variables. VisIt supports many different types of variables including:
Meshes
Scalars
Vectors
Tensors
Materials
Species
Meshes are the foundation of all the other types of variables. They consist of a discretization of space into cells. All the other variables are defined on the cells of the mesh.
Scalars are single valued fields and examples include density, pressure and temperature. Vectors are multi valued fields that have a direction and magnitude. Examples include velocity and magnetic fields. Tensors are multi valued fields that are typically thought of as 2 x 2 matrices in the case of 2D data and 3 x 3 matrices in the case of 3D data. The typical tensor variable is the stress tensor. Materials are a special type of variable that associates one or more materials with a cell. The location of the material is not specified within the cell and in the case of multi material cells, algorithms must be used to determine where the material is located in the cell, typically by looking at the materials in neighboring cells. Species are variables that are associated with each material. For a given material, species are a further breakdown of a material. The distinctive property of a species is that it is uniformly distributed throughout the material. For example, air consists of many different gases such as oxygen, nitrogen, carbon monoxide, carbon dioxide, etc.
1.1.2. Plots
Plots take variables and generate a visual representation of the variable. Some examples include the Mesh plot, which displays the mesh lines of the mesh, the Pseudocolor plot, which maps scalar variables to color, and the Vector plot, which displays vector glyphs indicating the direction and magnitude of a vector field. Plots work on specific types of variables and the graphical user interface limits the display of variables that can be used with a given plot to the appropriate variables.
1.1.3. Operators
Operators take variables and modify them in some way. Operators perform their operations before they are plotted. Multiple operators may be applied to a variable forming a pipeline. For example, a mesh may be subsetted so that all the values fall within a given range, furthermore, the mesh may be subsetted to a portion of the mesh within a user specified box.
1.1.4. Expressions
Expressions perform calculations on variables to generate new variables. Some common expressions consist of the standard mathematical operations such as addition, subtraction, multiplication and division. It also includes more complex operations such as gradient and divergence.
1.1.5. Queries
Queries summarize data and typically take variables as input and generate either a single value or some small number of values. Queries can also create curves, the most common of which is the result of a query over time that creates a curve of a scalar value over time. Some examples of queries include minimum, maximum, spatial extents and volume.
1.2. VisIt’s Architecture
VisIt has a client-server architecture that consists of one or more clients that connect to a viewer, which connects to one or more parallel servers. The clients and viewer typically run locally on the users desktop system while the parallel servers run on some remote high performance compute platform. This is shown in Figure 1.1. This is the most general case, but the components can also all run on a single system, either on the desktop or on a remote high performance compute platform. The server can also run in serial and for small datasets is completely sufficient.
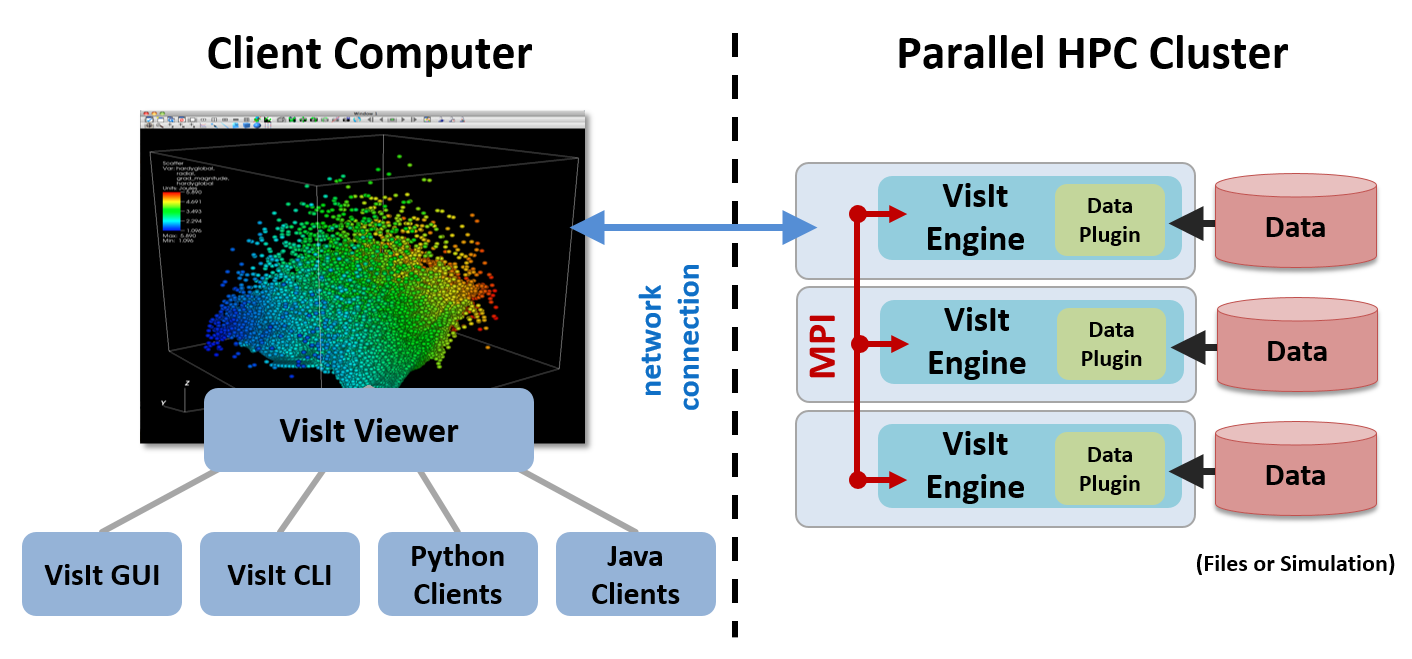
VisIt supports a number of different clients including a Graphical User Interface (GUI), a Python based Command Line Interface (CLI), and a Java programming interface. More than one client can be active at a time and VisIt coordinates the state between them so that they are consistent.
The viewer is responsible for displaying the visual results of the plots and coordinating the state information between the various clients.
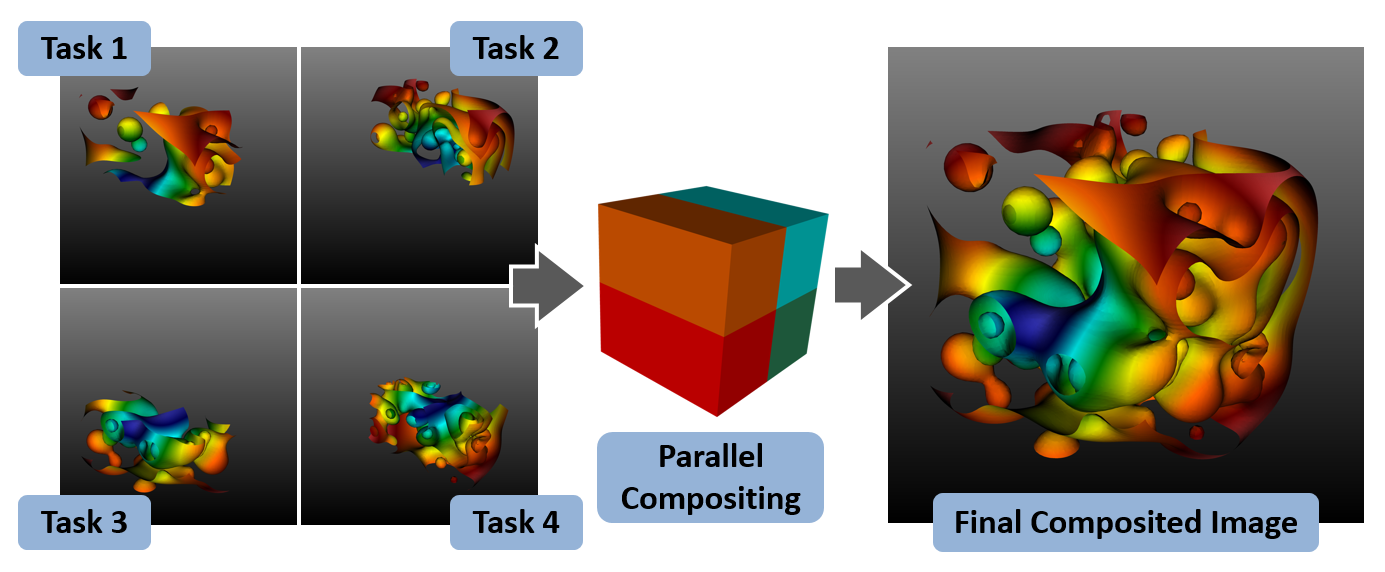
The server is responsible for reading the data from disk and performing all the manipulations on the data. The server reads and does all of its processing in parallel when running in parallel. The server can either render the data to be displayed in parallel or send the data to be rendered by the viewer. For small datasets, rendering in the viewer is faster and has less latency. For large datasets it is better to render the data in parallel (using scalable rendering) and then send the rendered image to the viewer for display. The implementation of scalable rendering is shown in Figure 1.2. VisIt is by default configured to automatically switch between shipping data to the viewer and performing scalable rendering based on the amount of geometry to be rendered.
1.3. VisIt’s Graphical User Interface
When you run the VisIt graphical user interface, you are seeing windows from the Qt based GUI and the viewer. The GUI is a VisIt client that provides the user interface and menus that let you choose what to visualize. The viewer displays all of the visualizations and is responsible for keeping track of VisIt’s state and coordinating this state with the other components. Both the GUI and the viewer are meant to run locally to take advantage of the local computer’s graphics hardware. The next two components can also be run on a client computer but they are more often run on a remote, parallel computer or cluster where the data files are generated.
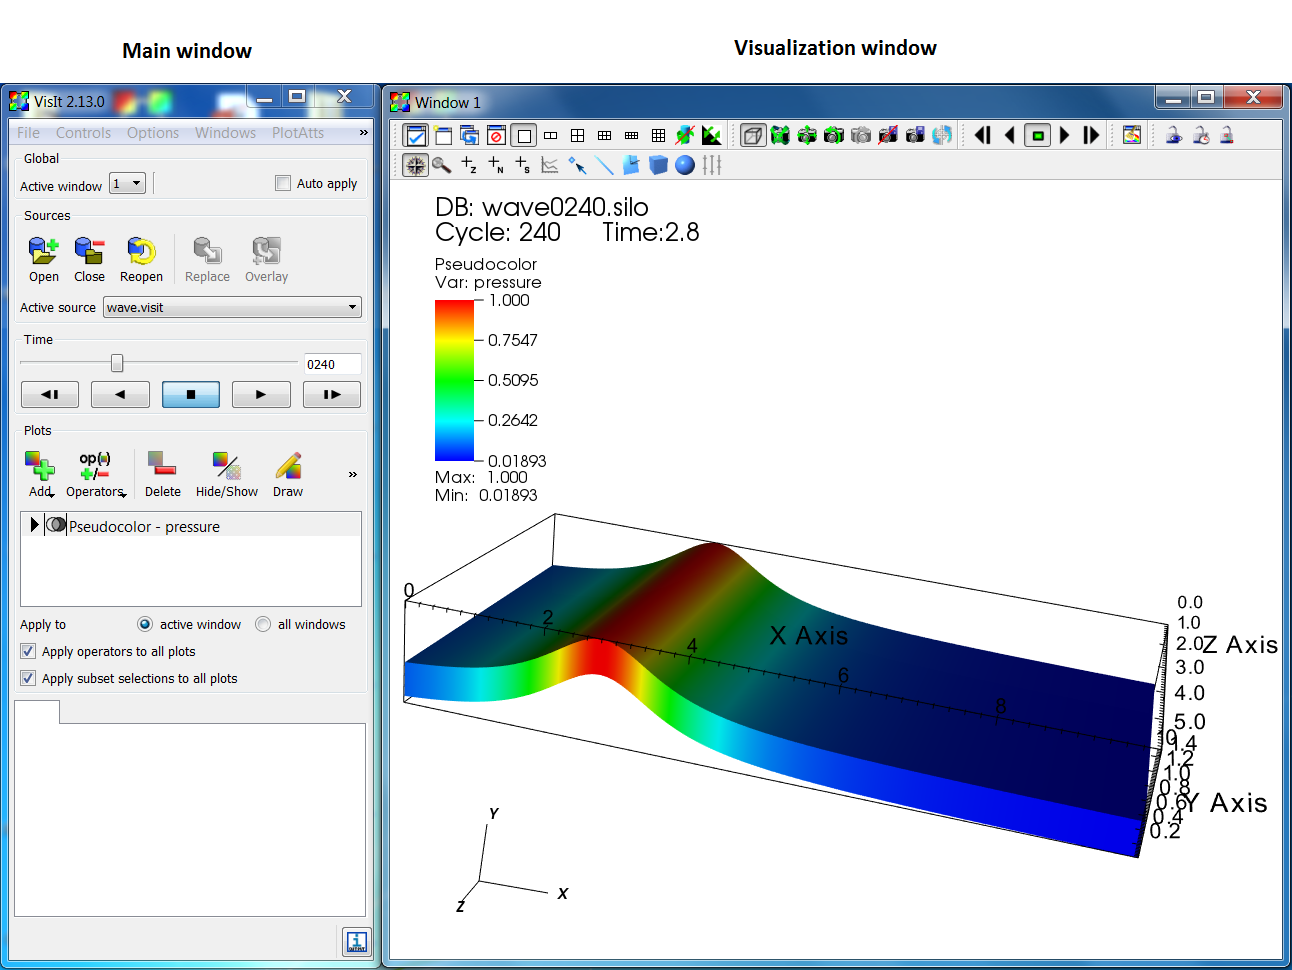
The viewer supports up to 16 visualization windows. Each window is independent of the others. VisIt uses an active window concept; all changes made in Main window or one of its popup windows apply to the currently active visualization window. The Main window and visualization window are shown in Figure 1.3.
Servers are launched on each machine where data to be visualized is located. Servers are launched on demand, typically when a database is opened. If there is more than one host profile on a system, VisIt will pop up a window asking which profile to use and additional properties such as the number of processors and nodes to use. The Host Profiles window is used to specify properties about the servers for different machines, such as the number of processors to use by default when running the server. The status of a compute engine is displayed in the Compute Engines window.