4.3.17. Isosurface operator
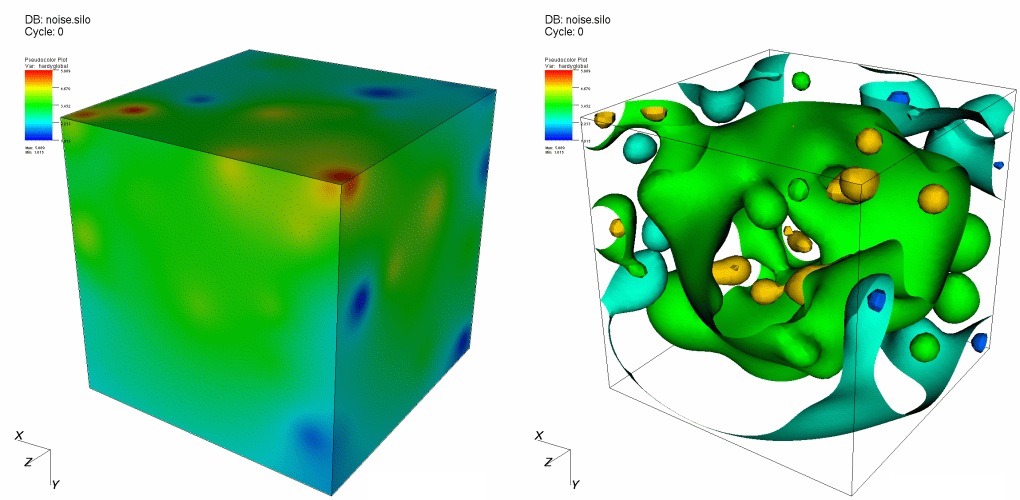
The Isosurface operator extracts surfaces from 2D or 3D databases and allows them to be plotted. The Isosurface operator takes as input a database and a list of values and creates a set of isosurfaces through the database. An isosurface is a surface where every point on the surface has the same data value. You can use an isosurface to see a surface through cells that contain a certain value. The Isosurface operator performs essentially the same visualization operation as the Contour plot, but it allows the resulting data to be used in VisIt’s other plots. For example, an Isosurface operator can be applied to a Pseudocolor plot where the Isosurface variable is different from the Pseudocolor variable. In that case, not only are the isosurfaces shown, but they are colored by another variable. An example of the Isosurface operator is shown in Figure 4.50.

Fig. 4.50 Isosurface operator example
4.3.17.1. Setting isosurface levels
By default, VisIt constructs 10 levels into which the data fall. These levels are linearly interpolated values between the data minimum and data maximum. However, you can set your own number of levels, specify the levels you want to see or indicate the percentages for the levels.

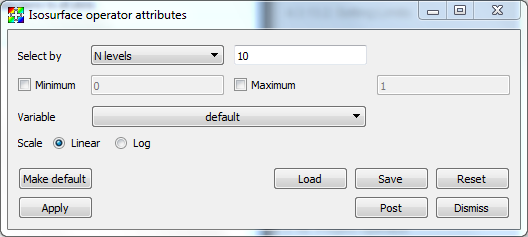
Fig. 4.51 Isosurface attributes
To choose how levels are specified, make a selection from the Select by menu. The available options are: N levels, Levels, and Percent. N levels, the default method, allows you to specify the number of levels that will be generated, with 10 being the default. Levels requires you to specify real numbers for the levels you want to see. Percent takes a list of percentages like 50.5 60 40. Using the numbers just mentioned, the first isosurface would be placed at the value which is 50.5% of the way between the minimum and maximum data values. The next isosurface would be placed at the value that is 60% of the way between the minimum and maximum data values, and so forth. You specify all values for setting the number of isosurfaces by typing into the text field to the right of the Select by menu.
4.3.17.2. Setting Limits
The Isosurface attributes window, shown in Figure 4.51, provides controls that allow you to specify artificial minima and maxima for the data in the plot. You might set limits when you have a small range of values that you are interested in and you only want the isosurfaces to be generated through that range. To set the minimum value, click the Minimum check box to enable the Minimum text field and then type a new minimum value into the text field. To set the maximum value, click the Maximum check box to enable the Maximum text field and then type a new maximum value into the text field. Note that either the minimum, maximum or both can be specified. If neither minimum nor maximum values are specified, VisIt uses the minimum and maximum values in the dataset.
4.3.17.3. Scaling
The Isosurface operator typically creates isosurfaces through a range of values by linearly interpolating to the next value. You can also change scales so a logarithmic function is used to get the list of isosurface values through the specified range. To change the scale, click either the Linear or Log radio buttons in the Isosurface attributes window.
4.3.17.4. Setting the isosurfacing variable
The Isosurface operator database variable can differ from the plotted variable. This enables plots to combine information from two variables by having isosurfaces of one variable and then coloring the resulting surfaces by another variable. You can change the isosurfacing variable, by selecting a new variable name from the Variable variable button.
Sometimes it is useful to set the isosurfacing variable when the plotted variable is not a scalar. For example, you might want to apply the Isosurface operator to a Mesh plot but the Mesh plot’s plotted variable is not a scalar so the Isosurface operator does not know what to do. To avoid this situation, you can set the isosurfacing variable to one you know to be scalar and the operator will succeed.