4.3.18. Isovolume operator

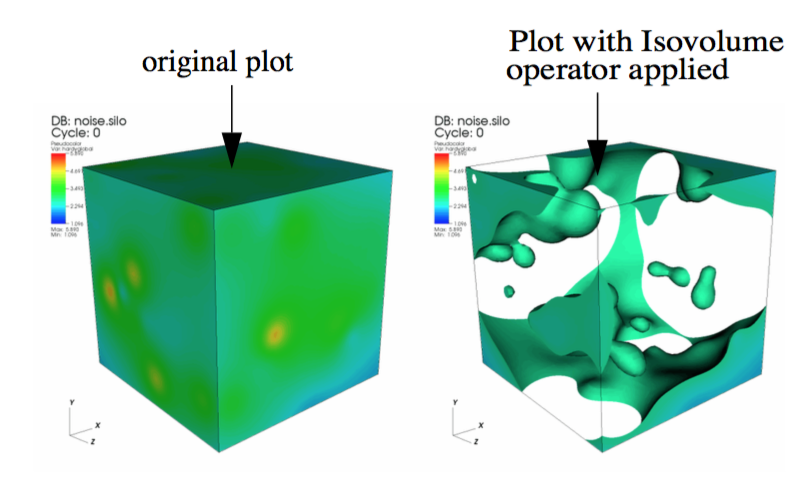
Fig. 4.52 Isovolume Operator Example
The Isovolume operator creates a new unstructured mesh using only cells and parts of cells from the original mesh that are within the specified data range for a variable. The resulting mesh can be used in other VisIt plots. You might use this operator when searching for cells that have certain values. The Isovolume operator can either use the plotted variable or a variable other than the plotted variable. For instance, you might want to see a Pseudocolor plot of pressure while using the Isovolume operator to remove all cells and parts of cells below a certain density. An example of a plot to which an Isovolume operator has been applied is shown in .
4.3.18.1. Using the Isovolume operator

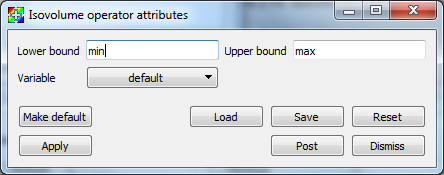
Fig. 4.53 Isovolume Attributes Window
The Isovolume operator iterates over every cell in a mesh and determines which parts of the cell, if any, contain a value that falls within a specified data range. If any parts of the cell are within the specified data range, they are kept as part of the operator’s output. The Isovolume operator uses an isosurfacing algorithm to determine the interfaces where cells should be split so the interfaces for neighboring cells are all continuous and fairly smooth. To specify a data range, type new upper and lower bounds into the Lower bound and Upper bound text fields in the Isovolume Attributes Window, which is shown in Figure 4.53.
The variable that the Isovolume operator uses does not necessarily have to match the plotted variable. If the plotted variable is to be used, the Variable text field must contain the word: default. If you want to make the Isovolume operator use a different variable so you can, for example, plot temperature but only look at regions that have a density greater than 2g/mL, you can set the Isovolume’s variable to temperature. To make the Isovolume operator use a different variable, select a new variable from the Variable variable button in the Isovolume Attributes Window.
If you apply this operator to a plot that does not operator on scalar variables such as the Mesh or Subset plots, be sure to set the variable because the default variables for those plots is never a scalar variable. Without a scalar variable, the Isovolume operator will not work.