4.3.33. Threshold operator
The Threshold operator extracts cells from 2D and 3D databases where the plotted variable falls into a specified range. The resulting database can be used in other VisIt plots. You might use this operator when searching for cells with certain values. One such example is searching for the cell with the minimum or maximum value for the plotted variable. The Threshold operator removes all cells that do not have values in the specified range, making it easy to spot cells with the desired values. The Threshold operator can also use variables other than the plotted variable, for instance, you might want to see a Pseudocolor plot of pressure while using the Threshold operator to remove all cells below a certain density. By specifying a different threshold variable, it is possible to visualize different quantities over the subset of cells specified by the threshold variable and range. An example of the Threshold operator is shown in Figure 4.79.
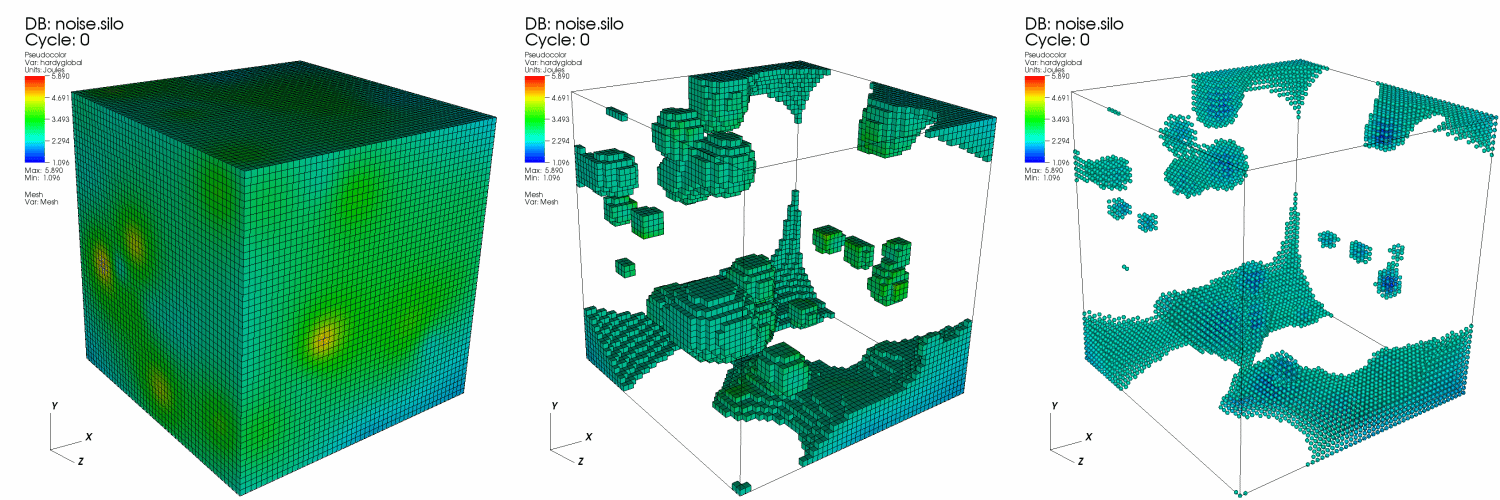
Fig. 4.79 Threshold operator example
4.3.33.1. Setting the variable range
The Threshold operator uses a range of values to determine which cells from the database should be kept in the visualization. For the Default bounds input, you specify the range of values by lower and upper bounds on the threshold variable. Cells with values below the lower bound or with values above the upper bound are removed from the visualization. To specify a new lower bound, type a new number or the special keyword: min into the Threshold attributes window’s (Figure 4.80) Lower bound text field. To specify a new upper bound, type a new number or the special keyword: max into the Upper bound text field.
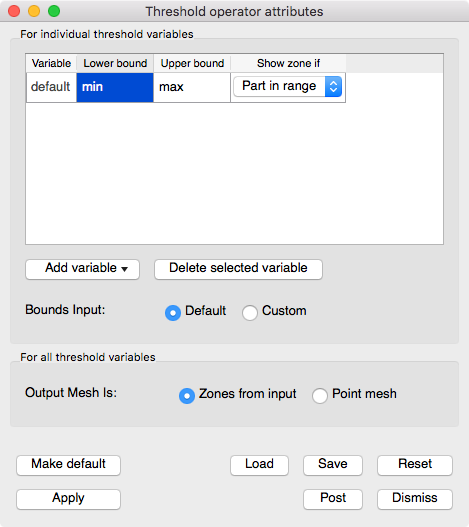
Fig. 4.80 Threshold attributes window - Default
For the Custom bounds input, you can specify a list of ranges in the Range text field. A colon - ‘:’ defines a range and a comma - ‘,’ defines a logical OR. The range shown in Figure 4.81 has the following meaning:
1 <= default <= 10 OR default = 17 OR 23 <= default <= max
Numbers, commas, and colons are the only valid symbols that can be used in specifying a range list.
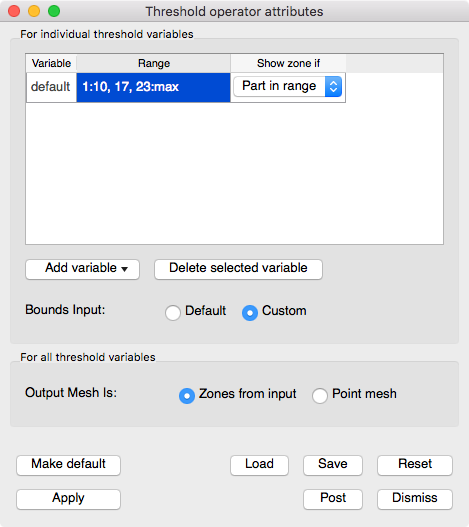
Fig. 4.81 Threshold attributes window - Custom
When the threshold variable is a nodal quantity, the cell being considered by the Threshold operator has values at each node in the cell. In this case, the Threshold operator provides a control that determines whether or not to keep the cell if some nodes have values in the threshold range or if all nodes have values in the threshold range. More cells are usually removed from the visualization when all nodes must be in the threshold range. Select Part in range from the Show zone if combo box to allow cells where at least one value is in the threshold range into the visualization. Select All in range from the Show zone if combo box to require that all nodal values exist in the threshold range.
4.3.33.2. Setting the threshold variable
The Threshold operator uses the threshold variable to determine whether cells remain in the visualization. The threshold variable is usually the plotted variable in which case the Variable column displays: default. To specify a threshold variable other than the plotted variable, click on the Add variable variable button and select a new scalar variable from the list of available variables.
You might set the threshold variable when you apply the Threshold operator to plots which do not take scalar variables as input. An example of this is the Mesh plot. When you apply the Threshold operator to a Mesh plot, you must set the threshold variable to a valid scalar variable for cells to be removed from the plot. You can also use the threshold variable to remove cells based on one variable while viewing the plotted variable.
4.3.33.3. Setting the output mesh type
The Threshold operator removes all cells that do not meet the threshold criterion, leaving behind a set of cells that are gathered into an unstructured mesh. Sometimes, it can be useful to transform the remaining cells into a point mesh. You can specify the desired output mesh type using the Cells from input and Point mesh radio buttons in the Threshold attributes window .