3.1. Working with Plots
A plot is a viewable object, created from a database, that can be displayed in a visualization window. VisIt provides several standard plot types that allow you to visualize data in different ways. The standard plots perform basic visualization operations like contouring, pseudocoloring as well as more sophisticated operations like volume rendering. All of VisIt’s plots are plugins so you can add new plot types by writing your own plot plugins. See the wiki at visitusers.org for more details on creating new plot plugins or send an e-mail inquiry to visit-users@elist.ornl.gov.
3.1.1. Managing Plots
To visualize your data, you will iteratively create and modify many plots until you achieve the end result. Since plots may be created and deleted many times, VisIt provides controls in its Main Window to handle these functions. The Plots area, shown in Figure 3.1, contains the controls for managing plots.
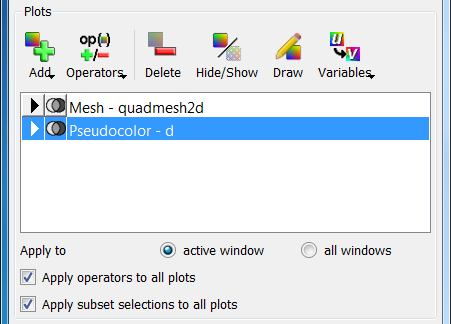
Fig. 3.1 The active plots area
The most prominent feature of the Plots area, the plot list contains a list of the plots that are in the active visualization window. The entries in the plot list contain the plot name and variable. Plot list entries change colors depending on the state of the plot. When plots are initially created, their plot list entries are green indicating that they are new and have not been submitted to the compute engine for processing. When a plot is being created on the compute engine, its plot list entry is yellow. When a plot has finished generating on the compute engine, its plot list entry turns black to indicate that the plot is done. If the compute engine cannot generate a plot, the plot’s plot list entry turns red to indicate an error with the plot.
The plot list displays more then just the names of the visualization window’s plots. The plot list also allows you to set the active plots, that is, those plots that can be modified. Highlighted plot entries are active.
The Add menu, an important part of the Plots area, contains the options that create new plots.
3.1.1.1. Creating a plot
To use any of VisIt’s capabilities, you must know how to create a plot. First, make sure you have opened a database. Once you have an open database, use the Add menu to create a plot.
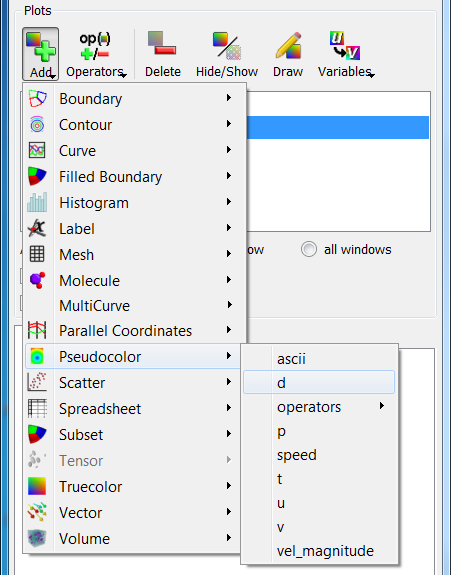
Fig. 3.2 The Add menu
Selecting the Add menu pops up a list of VisIt plot types. Plots for which the open database has no data are disabled. If a plot type is enabled, pulling the mouse toward the right while holding down the left button shows which variables can be plotted. Release the mouse button when the mouse cursor is over the variable that you want to plot, and a new plot list entry will appear in the plot list. The new plot list entry will be colored green in the plot list until VisIt is told to draw when you click the Draw button. The Add menu is disabled until a database is open.
3.1.1.2. Deleting a plot
VisIt deletes all the selected plots when you click the Delete button. If the plot list has keyboard focus, you can also delete a plot using the Delete key.
3.1.1.3. Selecting a plot
Since VisIt will only let you modify active plots, you must be able to select
plots. To select a plot, click on its entry in the plot list. Multiple plots
can be selected by holding down the Ctrl key and clicking plot entries
one at a time. Alternatively, groups of plot entries can be selected by
clicking on a plot entry and then clicking another plot entry while holding
down the Shift key.
3.1.1.4. Drawing a plot
When you add a plot to the plot list, it won’t be drawn until you click the Draw button. Once you do, the new plot’s plot list entry switches from green to yellow in the plot list to indicate that its results are pending and the compute engine starts generating the plot. Clicking the Draw button causes all new plots to be drawn.
3.1.1.5. Hiding a plot
When you are visualizing your data, you will often have many different plots
in the same visualization window. Sometimes you might want to temporarily
hide plots from view to more easily view the other plots in the window. To
hide the selected plots, click the Hide/Show button in the Plots
area. When a plot is hidden, its plot list entry is gray and contains the
word hidden to indicate that the plot is hidden. To show a hidden plot,
select the hidden plot and click the Hide/Show button again. Note that
plots must exist for the Hide/Show button to be enabled.
3.1.1.6. Setting plot attributes
Each plot type has its own plot attributes window used to set attributes for that plot type. Plot attributes windows are activated by double-clicking a plot entry in the plot list. You can also open a plot attribute window by selecting a plot type from the PlotAtts (Plot Attributes) menu shown in Figure 3.3,
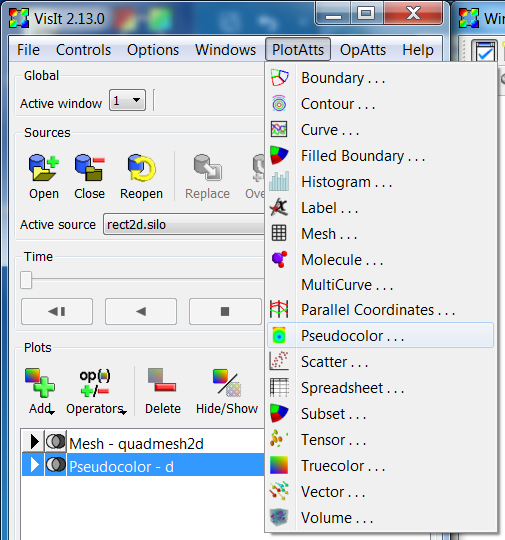
Fig. 3.3 The PlotAtts menu
3.1.1.7. Changing plot variables
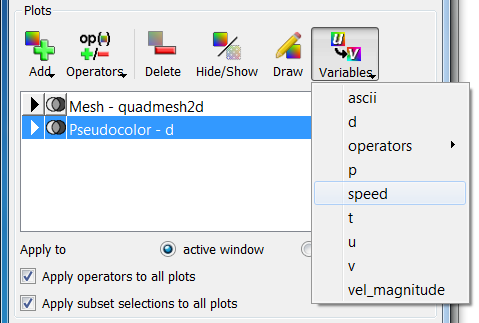
Fig. 3.4 The Variables menu
When examining a plot, you might want to look at another variable. For example, you might want to switch from looking at density to pressure. VisIt allows the plot variable to be changed without having to delete and recreate the plot. To change the plot variable, first make sure the plot is active, then select a new variable from the available variable names in the Variables menu. The Variables menu contains only the variables from the database that are compatible with the plot.