11. Interactive Tools
An interactive tool is an object that can be added to a visualization window to set attributes for certain plots and operators such as the Parallel Coordinates plot or Slice operator. You can turn interactive tools on and off by clicking on the tool icons in a visualization window’s Toolbar or Popup menu (see Figure 11.1). Note that some tools prefer to operate in visualization windows that contain plots of a certain dimension so some tools are not always available.
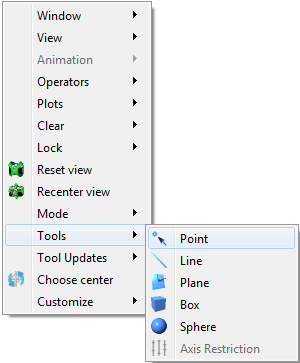
Fig. 11.1 Tools menu
Once you enable a tool, its appears in the visualization window. Tools have one or more small red rectangles called hot points that cause the tool to perform an action when you click or drag the hot point with the mouse. When you use the mouse to manipulate a tool’s hot point, all mouse events are delivered to the tool so it can respond to the mouse interaction. When the mouse is outside of a hot point, the mouse responds as it would if there were no tools activated so you can still rotate and zoom-in on plots while still having tools enabled.