9.2. Color Tables
A color table is a set of colors that is used by certain plots to color variables. Color tables can be immensely important for understanding visualizations since changes in color can highlight interesting features. VisIt has several built-in color tables that can be used in visualizations. VisIt also provides a Color table window for designing custom color tables.
Color tables come in two types: continuous and discrete. A continuous color table is defined as a relatively few color control points defined at certain intervals in the color table and the gaps in between the color control points are filled by smoothly interpolating the colors. This makes continuous color tables look smooth since there are several colors that are blended to form the color table. Continuous color tables are used by several plots including the Pseudocolor, Tensor, and Vector plots. A plot that uses a continuous color table attempts to use all of the colors in the color table. Some plots that opt to only use a handful of colors from a continuous color table pick colors that are evenly distributed through the color table so that the plots end up with colors that still somewhat resemble the original colors from the continuous color table.
A discrete color table is a set of N colors that can be set individually. There are no other colors in a discrete color table other than the colors that you provide. Discrete color tables are usually used by plots like the Boundary, Contour, FilledBoundary, or Subset plots, which need only a small set of colors. Typically, these plots use a color from a discrete color table to color some object and then use the next color to color another object, and so on. When they reach the end of the color table and still need more colors, they start again at the beginning with the first color from the discrete color table.
9.2.1. Color Table Window
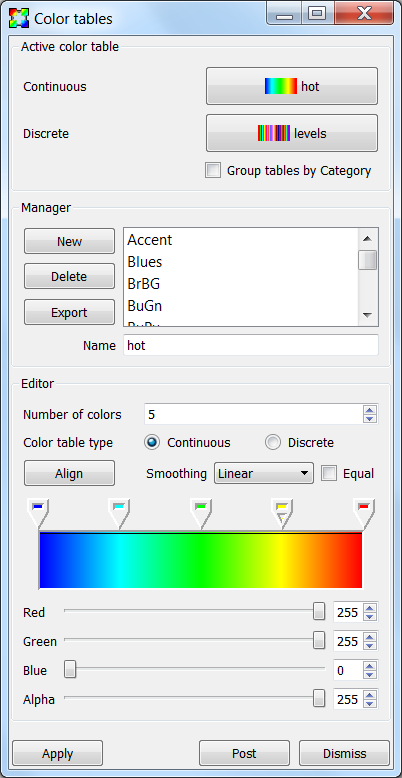
Fig. 9.25 The color table window
You can open VisIt’s Color table window, shown in Figure 9.25, by selecting Color table from the Main Window’s Controls menu. The Color table window is vertically separated into three areas. The top area allows you to set the active color tables. The middle area, or manager portion of the window, allows you to create or delete new color tables, as well as export color tables. The bottom area, or editor portion of the window, allows you to edit color tables by adding, removing, moving, or changing the color of color control points. A color control point is a point with a color that influences how the color table will look.
9.2.1.1. Setting the active color table
VisIt has the concept of active color tables, which are the color tables used to color plots that do not specify a color table. There is both an active continuous color table (for plots that prefer to use continuous color tables) and an active discrete color table (for plots that prefer to use discrete color tables). The active color table can be different for each visualization window. To set the active continuous color table, select a new color table name from the Continuous menu in the Active color table area. To select a new active discrete color table, select a new color table name from the Discrete menu in the Active color table area.
9.2.1.2. Creating a new color table
Creating a new color table is a simple process where you first type a new color table name into the Name text field and then click the New button. This creates a copy of the currently highlighted color table, which is the color table that is selected in the Manager area, and inserts it into the color table list with the specified name. After creating the new color table, you can modify the color control points to fashion a new color table.
9.2.1.3. Deleting a color table
To delete a color table, click on a color table name in the color table list and then click the Delete button. You can delete all color tables except for the last color table. VisIt makes no distinction between built-in color tables and user-defined color tables so any color table can be deleted. When you delete a color table, the active color table is set to the color table that comes first in the list. If a color table is in use when it is deleted, plots that used the deleted color table will use the default color table from that point on.
9.2.1.4. Exporting a color table
If you design a color table that you want to share with colleagues, click the Export button in the Manager area to save an XML file containing the color table definition for the highlighted color table to your .visit directory. The name of a color table file will usually be composed of the name of the color table with a “.ct” extension. Copying a color table file to a user’s .visit directory will allow VisIt to find the color table the next time VisIt runs. Look for the color table file in the directory in which VisIt was installed if you use the Windows version of VisIt.
9.2.1.5. Editing a continuous color table
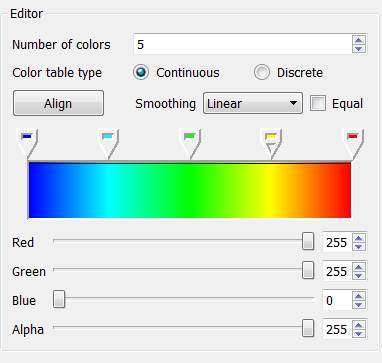
Fig. 9.26 The continuous color table editor
There are a handful of controls in the editor portion of the Color table window, shown in Figure 9.26, that are used to change the definition of a color table. To change a color table definition, you must alter its color control points. This means adding and removing color control points as well as changing their colors and locations.
You can change the number of color control points in a color table using the Number of colors spin box. When a new color control point is added, it appears to the right of the selected color control point and to the left of the next color control point. Color control points are represented as a pointy box just above the color spectrum. The color control point that has a small triangular mark is the selected color control point. When a color control point is removed, the color control point that was created before the deleted color control point becomes the new selected color control point. Clicking the Align button makes all color control points have equal spacing.
Clicking on a color control point makes it active. You can also use the Space bar if the color spectrum has keyboard focus. Clicking and dragging on a color control point changes its position. Clicking the arrow keys on the keyboard also moves a color control point. To change a color control point’s color, right click on it and choose a new color from the Popup color menu that appears under the mouse cursor. You can also change the color control point’s color by making the color control point active and then using the Red, Green and Blue sliders.
The Color table window also has a couple of settings that can be set to influence a color table’s appearance without having permanent effects on the color table. The Smoothing menu can be used to select between no smoothing, linear smoothing and cubic spline smoothing. The Equal check box can temporarily tell the color table to ignore the positions of its color control points and use equal spacing instead. The Equal check box is often used with no smoothing.
9.2.1.6. Editing a discrete color table
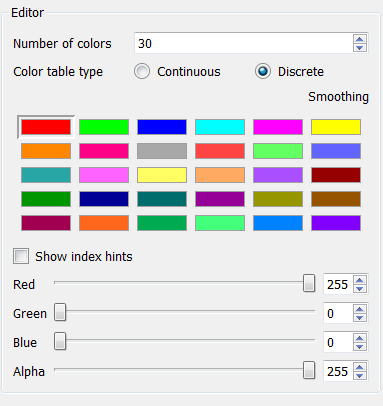
Fig. 9.27 The discrete color table editor
The Color table window’s Editor area looks different when you edit a discrete color table. Instead of showing a spectrum of colors, the window shows a grid of colors that correspond to the colors in the discrete color table. The order of the color control points if left to right, top to bottom. To edit a discrete color table, first left click on the color that you want to edit and then use the Red, Green, and Blue sliders to change the color. You can also right click on a color to select it and open the Popup color menu to choose a new color.
9.2.1.7. Editing color control point positions numerically
In both of the sections above, the color control points are positioned graphically using the GUI rather than specifying explicit numerical values.
When a variable is plotted, the variable’s values are mapped to the range
[0...1] to determine the colors to associate with the variable’s values.
A color table defines a 1:1 association of that range with a set of color
control points. Each control point in a color table is assigned a position
in the [0...1] range.
Sometimes, users want specific numerical values to map to specific colors. There is no way to achieve this through VisIt’s color table GUI. The only solution is to edit a color table manually or, if there are a large number of color control points to edit, to create a script that produces the color table.
For example, a user wanted a smoothly graded coloring of a variable using the following logic and colors…
| Variable Value Range | Hex Color |
|---|---|
| <0 | cccccc |
| 3 | 66ccff |
| 10 | 66ff66 |
| 25 | ffffcc |
| 50 | ffff00 |
| 100 | ff9900 |
| 1000 | ff0000 |
| >=5000 | 9900cc |
The above table has 8 colors. The input variable has range [0...5000].
The first step is to normalize the variable’s value transitions to the
[0...1] interval and convert the hexadecimal values to rgb colors
using a
color conversion tool.
This information is in the table below.
| Normalized Variable Value | RGB Color |
|---|---|
| <0.0 (0/5000) | 204 204 204 |
| 0.0006 (3/5000) | 102 204 255 |
| 0.002 (10/5000) | 102 255 102 |
| 0.005 (25/5000) | 255 255 204 |
| 0.01 (50/5000) | 255 255 000 |
| 0.02 (100/5000) | 255 153 000 |
| 0.2 (1000/5000) | 255 000 000 |
| >=1.0 (5000/5000) | 153 000 204 |
To create this color table, start VisIt’s GUI and go to
. There, enter a name for the
color table in the Name text box. Lets say it is named my8colors.
Clicking the New button adds the named table to the list of color
tables, copying the settings of the currently active color table. For the
example above, we wan the Number of colors to be set to 8 and the
Color table type to be Continuous. To create a file for this color
table that can be edited with a text editor, it needs to be exported by
clicking the Export button. This will create an XML file in
VUSER_HOME/my8colors.ct with 8 color control point
entries in it. At this point, the user should exit VisIt. With a text editor,
the user can now edit the file my8colors.ct. Starting at the top of the
file where the first color control point is defined (e.g. the one closest to
the zero end of the [0...1] range), edit the position and rgb color
of the first control point to match the values in the above table. Note that
there is a 4th entry for each rgb color. This is for setting transparency of
that color in the range [0...255] where 0 is fully transparent and
255 is fully opaque. If transparancy effects are not needed, this 4th
entry can be ignored and just always set equal to 255.
When VisIt is restarted, it will load this color table file. The user can then set this color table as the one to be used in various plots.
One final issue to deal with in this example is how to handle the
user’s goal of having all negative values in the input variable map
to the first color in the color table and all values greater or equal to 5000
to the last color. To do this, the user will have to define a new variable to
plot using a conditional expression of the form
if(lt(var,0),0,if(ge(var,5000),5000,var)) where var is the variable and
then use this new expression variable in place of var for the desired
behavior.
<?xml version="1.0"?>
<Object name="ColorTable">
    <Field name="Version" type="string">3.0.1</Field>
    <Object name="ColorControlPointList">
        <Object name="ColorControlPoint">
            <Field name="colors" type="unsignedCharArray" length="4">204 204 204 255 </Field>
            <Field name="position" type="float">0.0</Field>
        </Object>
        <Object name="ColorControlPoint">
            <Field name="colors" type="unsignedCharArray" length="4">102 204 255 255 </Field>
            <Field name="position" type="float">0.0006</Field>
        </Object>
        <Object name="ColorControlPoint">
            <Field name="colors" type="unsignedCharArray" length="4">102 255 102 255 </Field>
            <Field name="position" type="float">0.002</Field>
        </Object>
        <Object name="ColorControlPoint">
            <Field name="colors" type="unsignedCharArray" length="4">255 255 204 255 </Field>
            <Field name="position" type="float">0.005</Field>
        </Object>
        <Object name="ColorControlPoint">
            <Field name="colors" type="unsignedCharArray" length="4">255 255 0 255 </Field>
            <Field name="position" type="float">0.01</Field>
        </Object>
        <Object name="ColorControlPoint">
            <Field name="colors" type="unsignedCharArray" length="4">255 153 0 255 </Field>
            <Field name="position" type="float">0.02</Field>
        </Object>
        <Object name="ColorControlPoint">
            <Field name="colors" type="unsignedCharArray" length="4">255 0 0 255 </Field>
            <Field name="position" type="float">0.2</Field>
        </Object>
        <Object name="ColorControlPoint">
            <Field name="colors" type="unsignedCharArray" length="4">153 0 204 255 </Field>
            <Field name="position" type="float">1</Field>
        </Object>
        <Field name="category" type="string">UserDefined</Field>
    </Object>
</Object>
9.2.1.8. Numerically Controlled Banded Coloring
Sometimes it is convenient to create numerically controlled banded coloring of smoothly varying data. A Discrete color table does indeed wind up banding smoothly varying data. However, the band boundaries are uniformly spaced in the variable’s range and this may not always be desirable. Sometimes, it is desirable to have finely tuned banding around specific portions of the variable’s range. This requires the coordination of a Discrete color table and an appropriately constructed conditional expression.
For example, given the a smoothly varying variable, u, in the range
[-1...+1] shown in normal (e.g. hot) Pseudocolor plot in
Fig. 9.28.
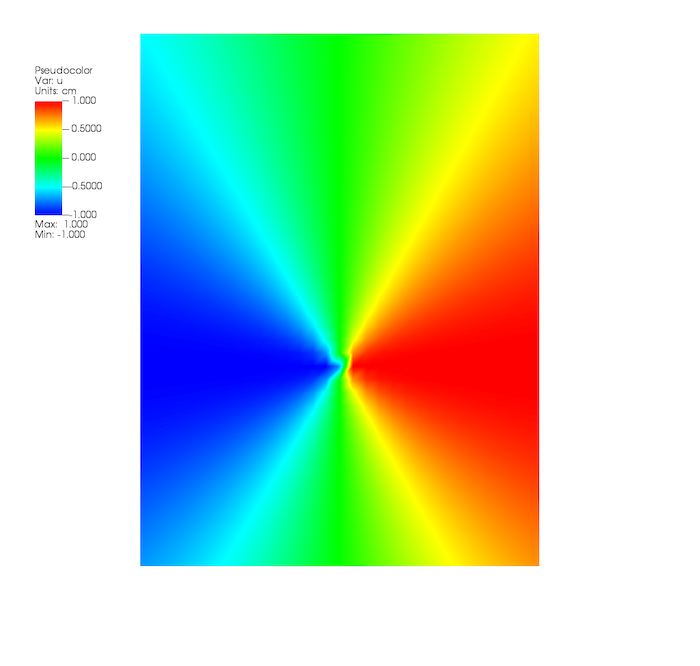
Fig. 9.28 Smoothly colored variable using hot color table.
we would like to produce a 4-color banded plot using the coloring logic in the table below…
| Values in Range | Map to this Hex Color |
|---|---|
| -inf…-0.95 | blue |
| -0.95…0 | cyan |
| 0…+0.95 | green |
| +0.95…+inf | red |
Using a 4-color Discrete color table alone, only the plot in Fig. 9.29 is produced.
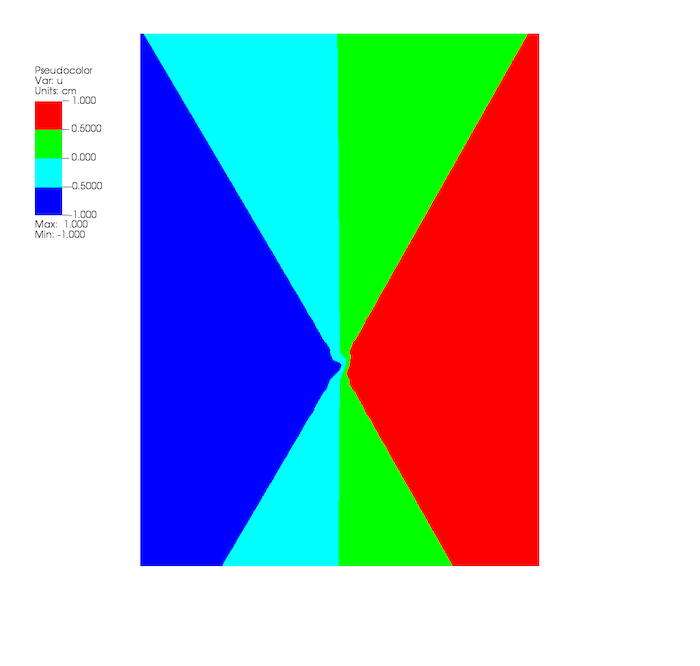
Fig. 9.29 A 4-color Discrete color table coloring alone
This is because the colors in a Discrete color table are always uniformly
spaced over the variable’s value range. To produce the desired coloring
we need to use a conditional expression that
maps the input variable into 4 distinct values using the range logic from
the table. In this case, the correct expression would be
if(lt(u,-0.95),0, if(lt(u,0),1, if(lt(u,0.95),2,3))). Then, plotting this
expression using the 4-color Discrete color table, the desired coloring is
produced as shown in
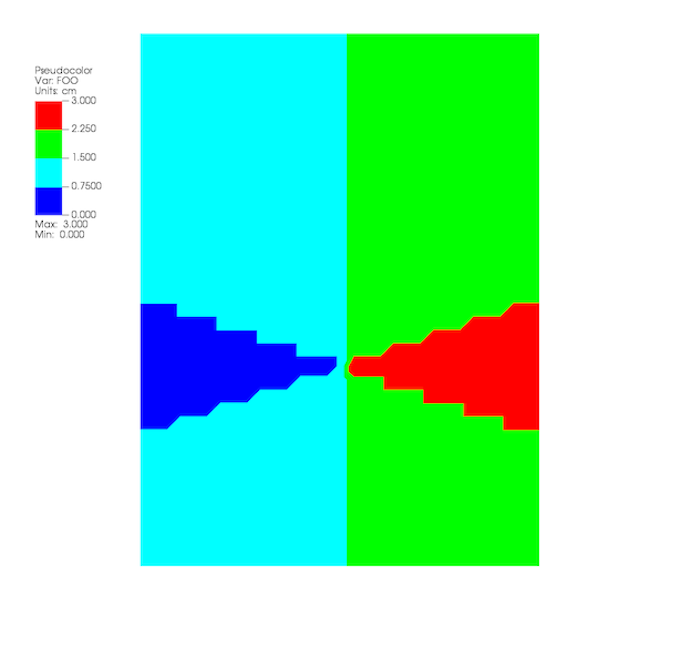
Fig. 9.30 A 4-color Discrete color table coloring combined with a conditional expression
9.2.1.9. Converting color table types
It is possible to convert a continuous color table to a discrete color table and vice-versa using the Continuous and Discrete radio buttons in the editor portion of the Color table window. Changing the color table type from discrete to continuous does not change the color table’s color control points; it only changes how they are used. If you select the levels color table and click the Continuous radio button, the color table will be changed into a continuous color table and the Editor area will change to continuous mode and show the color table in a spectrum but no color control points will have changed. You can even turn the color table back into a discrete color table and the Editor area will show the color table in discrete mode, but the color control points will not have changed.