12.4. Multiple window operations
This section focuses on some of the common techniques for exploring multiple databases when you have multiple visualization windows.
12.4.1. Reflection and Translation
When you visualize multiple related databases, they often occupy the same space in the visualization window since they may have been generated using the same computational mesh but with different physics. When this is the case, you can modify the location of the plots from one of the databases in two immediately obvious ways. First of all, if you simulated the same object and it does not make use of any symmetry then you could use the Transform operator to translate the coordinate system of one of the plots out of the way of the other plot so you can look at the two plots from the different databases side by side in the same visualization window. If your databases make use of symmetry (maybe you only simulated half of the problem) then you can apply the Reflect operator to one of the plots to show them side by side but reflected to show the entire problem. Each method has its merits.
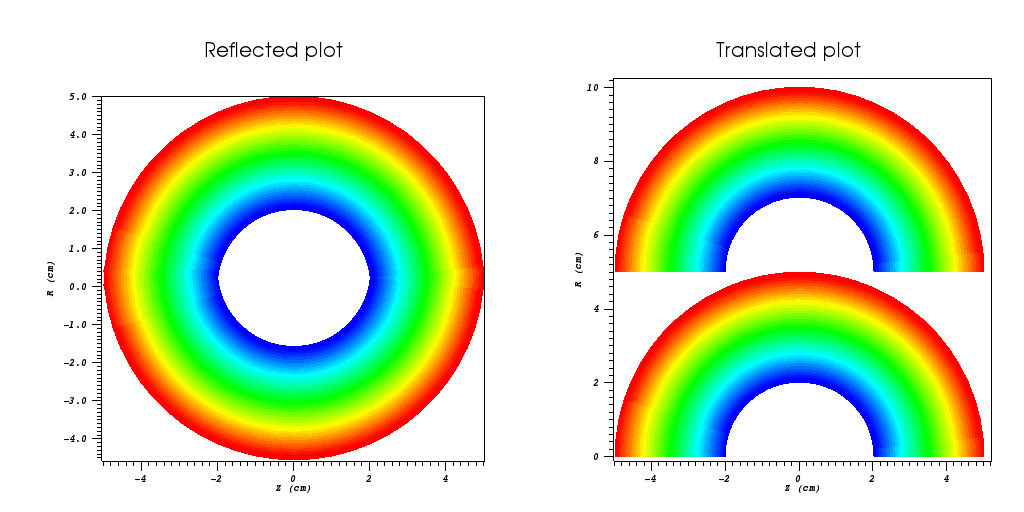
Fig. 12.18 Plots side by side using the Reflect or Transform operator
12.4.2. Copying Windows
If you visualize multiple databases and you want to create identical plots for each database but have them placed in different visualization windows then you can either have VisIt copy windows on first reference or you can clone an existing window and then replace the database used in the new window’s plots with a different database.
If you have already created multiple visualization windows, perhaps as the result of a change to VisIt’s layout, then you can make VisIt copy the attributes of the active window to another visualization window when you switch active windows by enabling Clone window on first reference in the Preferences Window. To open the Preferences Window, choose the Preferences option from the Main Window’s Options menu. This form of window cloning copies the plots, lights, colors, etc from the active window to a pre-existing visualization window when you access it for the first time. If you have already accessed a visualization window but you would still like to copy plots, lights, colors, etc from another visualization window, you can make the destination visualization window be the active window and then copy everything from the source visualization window using the Copy everything menu option in the Main Window’s Windows menu.
If you have no empty visualization window to contain plots for the another database, you can click the Clone option in the Main Window’s Windows menu to create a new visualization window with the same plots and settings as the active window. Once the new window has been created, you could visualize a new database by choosing a new database in the Active source combo box and clicking the Replace button.
12.4.3. Locking Windows
When you visualize databases using multiple visualization windows, it is often convenient to keep the timestate and view in sync between windows so you can concentrate on comparing plots instead of dealing with the intricacies of setting the view or timestate for each visualization window. VisIt’s visualization windows can be locked with respect to time, view, or interactive tools. To lock visualization windows, use the Popup menu, Toolbar, or the Lock options from the Main Window’s Windows menu as shown in Figure 12.19.
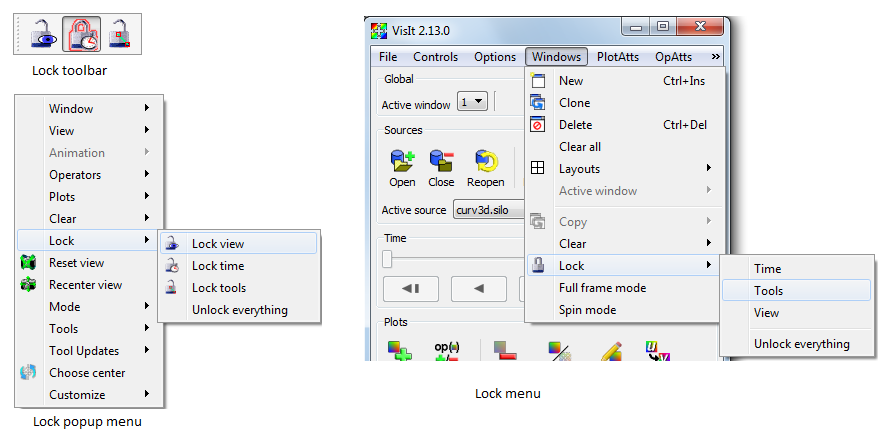
Fig. 12.19 Mechanisms for locking windows
12.4.3.1. Locking views
If you have created plots from related databases in multiple visualization windows, you can lock the views for the visualization windows together so that as you change the view in one of the visualization windows with a locked view, the other visualization windows with locked views also update to have the same view. There are four types of views in VisIt: curve, 2D, 3D, and AxisArray. If you have 2D plots in a visualization window, the visualization window is considered to be 2D. Locking that 2D visualization window’s view will only update other visualization windows that are also 2D and vice-versa. The same is true for curve, 3D and AxisArray views.
12.4.3.2. Locking time
If you have created plots from related databases in multiple visualization windows, you can lock the visualization windows together in time so that as you change time in one visualization window, it updates in all other visualization windows that are locked in time.
Locking visualization windows together in time may cause VisIt to prompt you to create a new database correlation that involves all of the databases in the visualization windows that are locked in time. VisIt creates a database correlation because the visualization windows must use a common time slider to really be locked in time. If the visualization windows did not use a common time slider then changing time in one visualization window would not cause other visualization windows to update. Once VisIt creates a suitable database correlation for all windows, the active time slider is set to that database correlation in all visualization windows that are locked in time. If you alter a database correlation at this point, it will cause the timestate in each locked visualization window to change. Since the same database correlation is used in all locked visualization windows, changing the timestate for the database correlation changes the timestate in all of the locked windows. This frees you to examine time-varying database behavior without having to set the timestate independently in each visualization window. See Database correlations for more information.
12.4.3.3. Locking tools
In addition to locking visualization windows together with respect to the view and time, you can also lock their tools. This capability can be useful when exploring data that often requires the use of an operator whose attributes can be set interactively using a tool since the same tool can be used to set the operator attributes for operators in more than one visualization window. See Interactive Tools for information on the different tools and how they are used.
Consider the following scenario: you have two related 3D databases and you want to examine the same slice plane for each database and you want each database to be plotted in a separate visualization window. You can set up separate visualization windows and slice the plots from each database independently but locking tools is easier and requires much less setup.
Start off by opening the first 3D database and create the desired plots from it. If you want to maintain a 3D view of the plots, you can clone the visualization window to get a new window with the same plots or you can apply a Slice operator to the plots. Apply a Slice operator but make sure the slice is not projected to 2D and also be sure that its Interactive check box is turned on. Turn on VisIt’s plane tool and make sure that tools are locked. Clone the visualization window twice and for each of the new visualization windows, make sure that their Slice operator projects to 2D. There should now be four visualization windows if you opted to keep a 3D view of the data. In the last visualization window, replace the database with another related database that you want to compare to the first database.
Now that all of the setup steps are complete, you can save a session file so you can get back to this state when you run VisIt next time. Now, in the window that still has a slice in 3D, use the plane tool to reposition the slice. Both of the 2D visualization windows should also update so they use the new slice plane attributes calculated by the plane tool. The four visualization windows, arranged in a 2x2 window layout are shown in Figure 12.20.
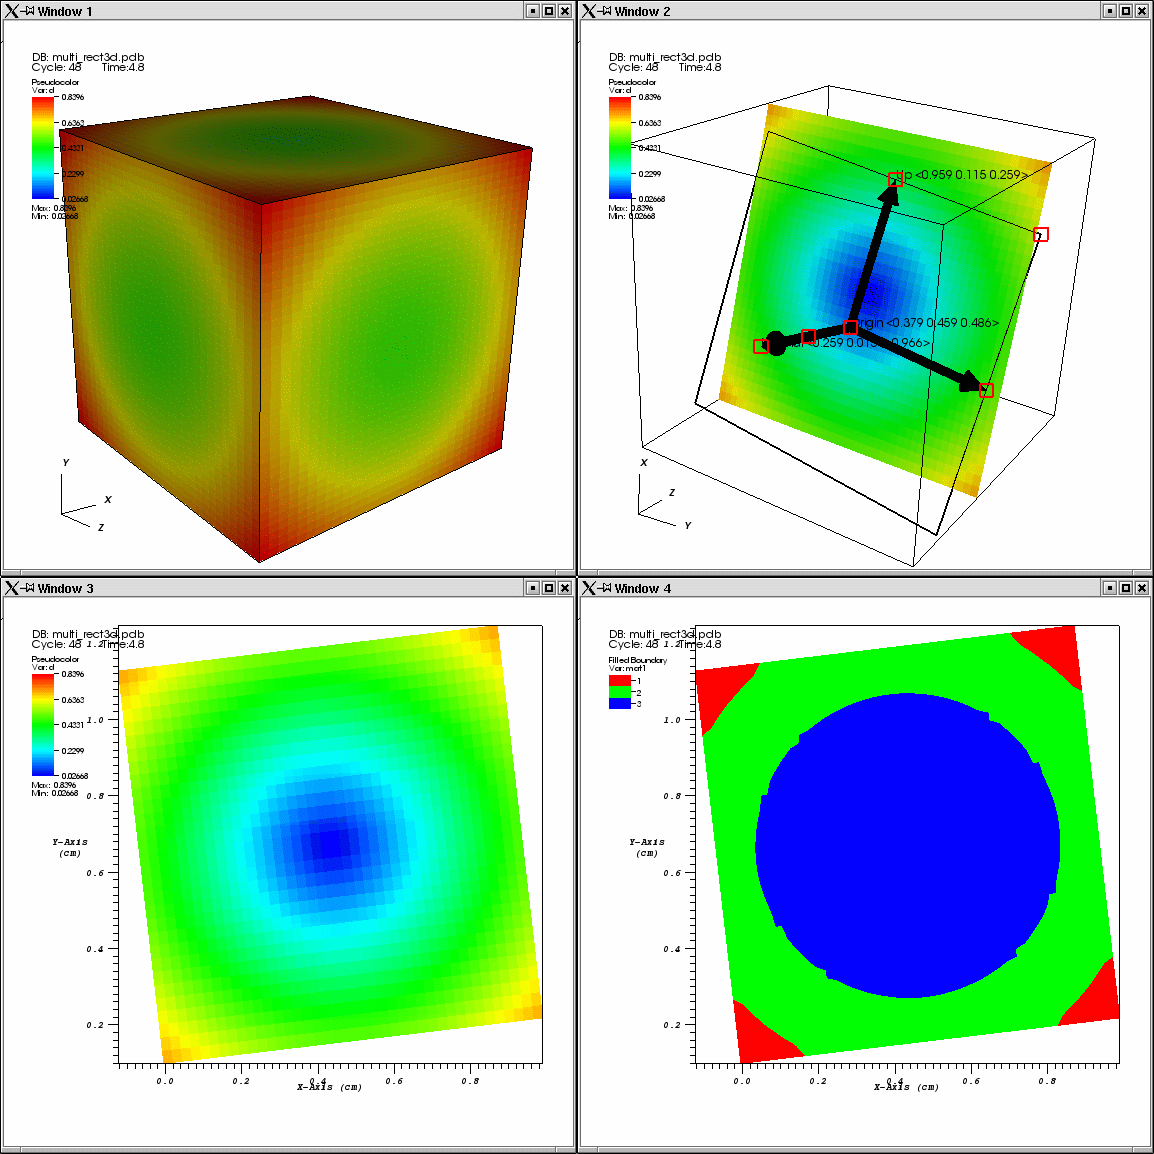
Fig. 12.20 Multiple visualization windows with locked tools