4.3.24. Reflect operator
Use the Reflect operator to reflect database geometry across one or more axes. Scientific simulations often rely on symmetry so they only need to simulate part of the problem. When creating a visualization, most users want to see the entire object that was simulated. This often involves reflecting the database geometry to create the full geometry of the simulated object. VisIt’s Reflect operator can be applied to both 2D and 3D databases and can reflect them across one or more plot axes. An example of the Reflect operator is shown in Figure 4.59.
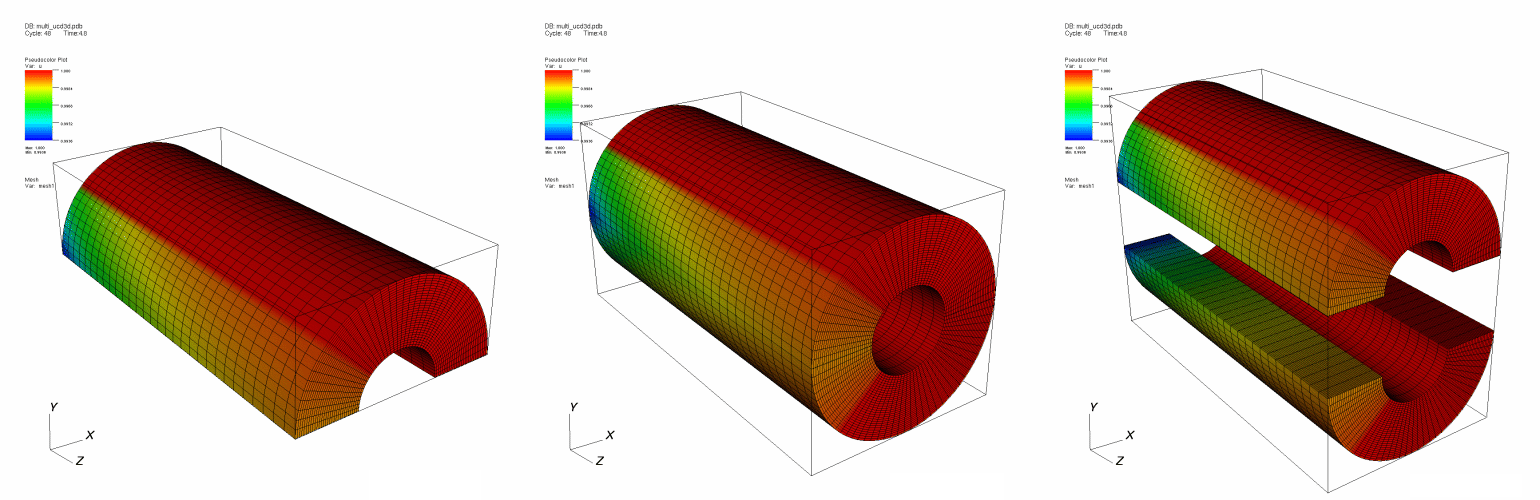
Fig. 4.59 Reflect operator example
4.3.24.1. Setting the Reflect attribute window’s input mode
The Reflect attributes window, shown in Figure 4.60, has two input modes. One input mode is for 2D data, in which only reflection quadrants are shown, and the second input mode is for 3D data for which the window shows 3D octants. In either input mode, clicking on the brightly colored shapes turns on different reflections and in the 3D input mode, clicking on the cyan arrow rotates the view so you can more easily get to reflections in the back. To set the input mode, click either the 2D or 3D radio buttons.
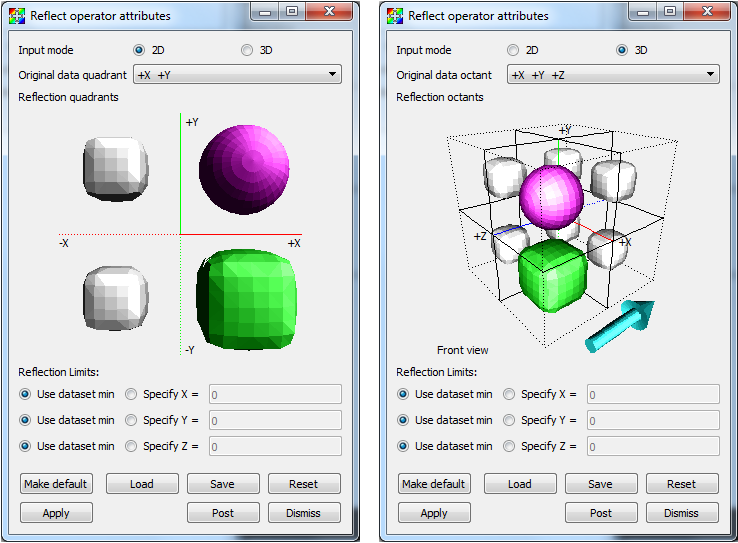
Fig. 4.60 Reflect attributes window
4.3.24.2. Setting the data octant
The Reflect operator assumes that the database being reflected resides in the +X+Y+Z octant when performing its reflections. Sometimes, due to the orientation of the database geometry, it is convenient to assume the geometry exists in another octant. To change the data octant, make a new selection from the Original data octant menu in the Reflect attributes window. The Reflect attributes window graphically depicts the original data octant as the octant that contains a sphere instead of a cube, which correspond only to reflections.
4.3.24.3. Reflecting plots
Once the Reflect operator has been applied to plots, you must usually specify the direction in which the plots should be reflected. To set the plot direction, click on the glyphs below the Original data octant menu. The possible reflections are shown by cube and sphere glyphs. When a reflection is set to be on, the glyph in the octant or quadrant will be green or magenta. When a reflection is not on, its glyph is smaller and silver. To turn a reflection on or off, just click on its glyph. If the window is in its 3D input mode and you need to access octants in the back that are obscured by other octants, clicking on the cyan arrow will rotate the glyphs so the octants in the back will be more accessible.
4.3.24.4. Reflection limits
Reflection limits determine the axes about which the database geometry is reflected. The Reflect attributes window has three reflection limits controls; one for each dimension. You will usually want to reflect plots using the dataset min value, which you set by clicking the Use dataset min radio button. When using the dataset min value to reflect plots, the reflected plots will touch along the reflected edge. You can also specify another axis of reflection. When using a custom axis of reflection, the reflected plots will not necessarily touch. This option, though not normally needed, can produce interesting effects in animations. To specify a custom axis of reflection, click the Specify X, Specify Y, or Specify Z radio buttons and enter a new X, Y, or Z value into the appropriate text field.