11.2. Line Tool
It is common to create Curve plots when analyzing a simulation database. Curve plots are created using VisIt’s lineout mechanism where reference lines are drawn in a visualization window and Curve plots are created in another visualization window using the path described by the reference lines. VisIt’s line tool allows reference lines to be moved after they are initially drawn. The line tool allows the user to see a representation of a line in a visualization window and position the line relative to plots that exist in the window.
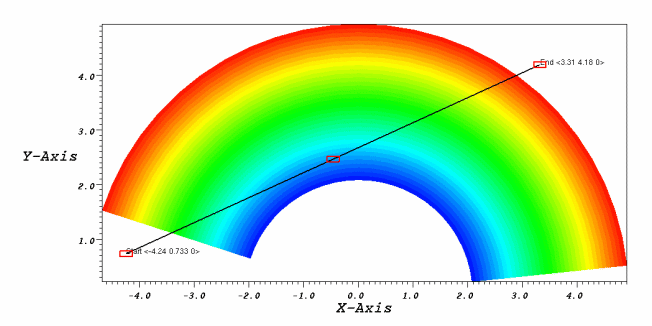
Fig. 11.4 Line tool with a 2D plot
The line tool is drawn as a thick line with three hot points positioned along the length of the line. Both of the line tool’s endpoints, as well as its center, have a hotpoint. Since the line tool can be used for both 2D and 3D databases, the line tool’s behavior is slightly different for 2D than it is for 3D. Clicking and dragging on either endpoint will move the selected endpoint causing the line to change shape. Another way of moving an endpoint is to hold down the Ctrl key and then click on the point and move the mouse up and down to extend or shorten the line. Clicking and dragging the middle hot point moves the entire line tool.
In 2D, the line endpoints can only be moved in the X-Y plane (Figure 11.4). In 3D, the line endpoints can be moved in any dimension. Since it is more difficult to see how the line is oriented relative to plots in 3D, when the line tool is moved, 3D crosshairs appear. The crosshairs intersect the bounding box and show the position of the line endpoint relative to the plots. Clicking and dragging endpoints will move them in a plane that is perpendicular to the screen. Moving the endpoints, while first pressing and holding down the Shift key, causes the selected endpoint to move back and forth in the dimension that most faces the screen. This allows endpoints to be moved in one dimension at a time. An example of the line tool in 3D is shown in Figure 11.5.
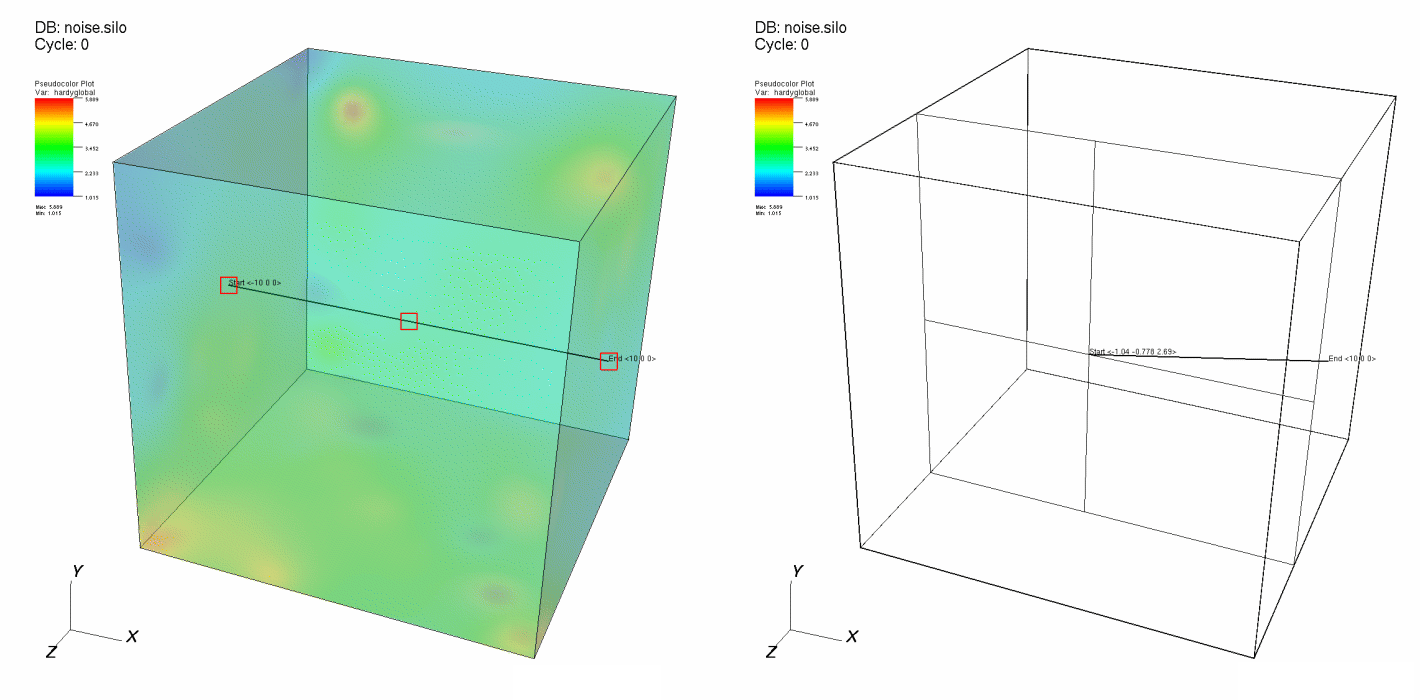
Fig. 11.5 Line tool in 3D
The line tool can be used to set the attributes for certain VisIt operators such as VisIt’s Lineout operator. If a plot has a Lineout operator applied to it, and the Lineout operator’s interactive option is turned on (see Lineout’s Interactive mode for more details), the line tool is initialized with that operator’s endpoints when it is first enabled. (Note: Due to a current bug, the tool must be activated, deactivated, then activated a second time in order to be properly initialized with the Lineout’s endpoint values.) As the line tool is repositioned and reoriented, the line tool’s line endpoints are given to the Lineout operator and the Curve plots that are fed by the Lineout operator are recalculated.