9.2. Color Tables
A color table is a set of colors that is used by certain plots to color variables. Color tables can be immensely important for understanding visualizations since changes in color can highlight interesting features. VisIt has several built-in color tables that can be used in visualizations. VisIt also provides a Color Table Window for organizing and designing color tables.
Color tables come in two types: continuous and discrete. Their definitions are dependent upon our notion of a color control point, which is defined as a point in one dimensional space (also between 0 and 1) that has color information (i.e. RGBA values). A continuous color table is defined as a set of (relatively few) color control points defined at certain intervals such that the gaps between adjacent points are filled by smoothly interpolating their colors. This makes continuous color tables look smooth since there are several colors that are blended to form the color table. Continuous color tables are used by several plots including the Pseudocolor, Tensor, and Vector plots. A plot that uses a continuous color table attempts to use all of the colors in the color table. Some plots that opt to only use a handful of colors from a continuous color table pick colors that are evenly distributed throughout the color table so that the plots end up with colors that still somewhat resemble the original colors from the continuous color table.
A discrete color table is a set of N colors that can be set individually. There are no other colors in a discrete color table other than the colors that you provide. Internally, a discrete color table is represented as a set of color control points. Their respective positions correspond to the order the colors appear in. Discrete color tables are usually used by plots like the Boundary, Contour, FilledBoundary, or Subset plots, which need only a small set of colors. Typically, these plots use a color from a discrete color table to color some object and then use the next color to color another object, and so on. When they reach the end of the color table and still need more colors, they start again at the beginning with the first color from the discrete color table.
9.2.1. Color Table Window
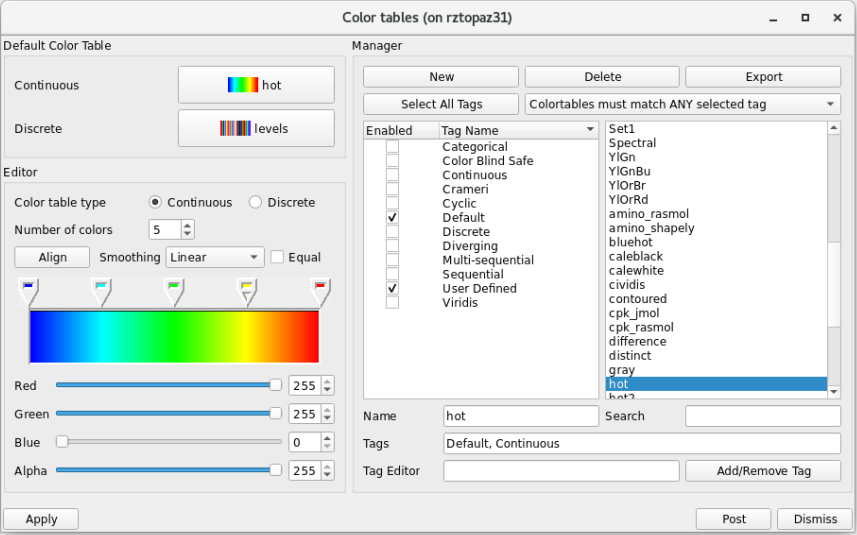
Fig. 9.31 The color table window
You can open VisIt’s Color table window, shown in Figure 9.31, by selecting Color table from the Main Window’s Controls menu, or by pressing ctrl + t.
The Color table window is separated into three areas: The top area allows you to set the default color tables.
The right-hand side, or the manager portion of the window, allows you to create, delete, and export new color tables, as well as organize all the available color tables.
See Filtering With Tags for more information.
The left-hand side, or editor portion of the window, allows you to edit color tables by adding, removing, moving, or changing the color of control points.
A color control point is a point with a color that influences how colors vary through the table.
9.2.1.1. Setting the default color table
VisIt has a concept of default color tables, which are the color tables used to color plots that do not specify a color table. There is both a default continuous color table (for plots that prefer to use continuous color tables) and a default discrete color table (for plots that prefer to use discrete color tables). The default color table can be different for each visualization window. To set the default continuous color table, select a new color table name from the Continuous menu in the Default color table area. To select a new default discrete color table, select a new color table name from the Discrete menu in the Default color table area. If you would like to see more or less color table options for both the Continuous and Discrete buttons, see Filtering With Tags for instructions on filtering which color tables are available to be used.
9.2.1.2. Creating a new color table
Creating a new color table is a simple process where you first type a new color table name into the Name text field and then click the New button. This creates a copy of the currently highlighted color table, which is the color table that is selected in the Manager area, and inserts it into the color table list with the specified name. After creating the new color table, you can modify the color control points and other attributes to fashion a new color table.
9.2.1.3. Deleting a color table
To delete a color table, click on a color table name in the color table list and then click the Delete button. You can only delete color tables that are not built-in to VisIt. When you delete a color table that is currently set as one of your default color tables, the default color table is set to the color table that comes first in the list. If a color table is in use when it is deleted, plots that used the deleted color table will use the default color table from that point on.
9.2.1.4. Exporting a color table
If you design a color table that you want to share with colleagues or otherwise use in the future, click the Export button in the Manager area to save an XML file containing the color table definition for the highlighted color table to your .visit directory. The name of a color table file will usually be composed of the name of the color table with a “.ct” extension. Copying a color table file to a user’s .visit directory will allow VisIt to find the color table the next time VisIt runs. Look for the color table file in the directory in which VisIt was installed if you use the Windows version of VisIt.
9.2.1.5. Editing a continuous color table
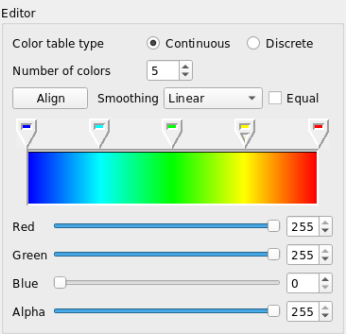
Fig. 9.32 The continuous color table editor
There are a handful of controls in the editor portion of the Color table window, shown in Figure 9.32, that are used to change the definition of a color table. To change a color table definition, you must alter its color control points. This means adding and removing color control points as well as changing their colors and locations.
You can change the number of color control points in a color table using the Number of colors spin box. When a new color control point is added, it appears to the right of the selected color control point and to the left of the next color control point. Color control points are represented as a pointy box just above the color spectrum. The color control point that has a small triangular mark is the selected color control point. When a color control point is removed, the color control point that was created before the deleted color control point becomes the new selected color control point. Clicking the Align button makes all color control points have equal spacing.
Clicking on a color control point makes it active. You can also use the Space bar if the color spectrum has keyboard focus. Clicking and dragging on a color control point changes its position. Clicking the arrow keys on the keyboard also moves a color control point. To change a color control point’s color, right click on it and choose a new color from the Popup color menu that appears under the mouse cursor. You can also change the color control point’s color by making the color control point active and then using the Red, Green and Blue sliders.
The Color table window also has a couple of settings that can be set to influence a color table’s appearance without having permanent effects on the color table. The Smoothing menu can be used to select between no smoothing, linear smoothing and cubic spline smoothing. The Equal check box can temporarily tell the color table to ignore the positions of its color control points and use equal spacing instead. The Equal check box is often used with no smoothing.
9.2.1.6. Editing a discrete color table
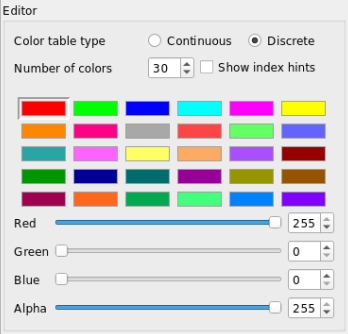
Fig. 9.33 The discrete color table editor
The Color table window’s Editor area looks different when you edit a discrete color table. Instead of showing a spectrum of colors, the window shows a grid of colors that correspond to the colors in the discrete color table. The order of the color control points is left to right, top to bottom. To edit a discrete color table, first left click on the color that you want to edit and then use the Red, Green, and Blue sliders to change the color. You can also right click on a color to select it and open the Popup color menu to choose a new color.
9.2.1.7. Editing color control point positions numerically
In both of the sections above, the color control points are positioned graphically using the GUI rather than specifying explicit numerical values.
When a variable is plotted, the variable’s values are mapped to the range
[0...1] to determine the colors to associate with the variable’s values.
A color table defines a 1:1 association of that range with a set of color
control points. Each control point in a color table is assigned a position
in the [0...1] range.
Sometimes, users want specific numerical values to map to specific colors. There is no way to achieve this through VisIt’s color table GUI. The only solution is to edit a color table manually or, if there are a large number of color control points to edit, to create a script that produces the color table.
For example, a user wanted a smoothly graded coloring of a variable using the following logic and colors…
Variable Value Range |
Hex Color |
|---|---|
<0 |
cccccc |
3 |
66ccff |
10 |
66ff66 |
25 |
ffffcc |
50 |
ffff00 |
100 |
ff9900 |
1000 |
ff0000 |
>=5000 |
9900cc |
The above table has 8 colors. The input variable has range [0...5000].
The first step is to normalize the variable’s value transitions to the
[0...1] interval and convert the hexadecimal values to rgb colors
using a
color conversion tool.
This information is in the table below.
Normalized Variable Value |
RGB Color |
|---|---|
<0.0 (0/5000) |
204 204 204 |
0.0006 (3/5000) |
102 204 255 |
0.002 (10/5000) |
102 255 102 |
0.005 (25/5000) |
255 255 204 |
0.01 (50/5000) |
255 255 000 |
0.02 (100/5000) |
255 153 000 |
0.2 (1000/5000) |
255 000 000 |
>=1.0 (5000/5000) |
153 000 204 |
To create this color table, start VisIt’s GUI and go to
. There, enter a name for the
color table in the Name text box. Lets say it is named my8colors.
Clicking the New button adds the named table to the list of color
tables, copying the settings of the default color table. For the
example above, we want the Number of colors to be set to 8 and the
Color table type to be Continuous. To create a file for this color
table that can be edited with a text editor, it needs to be exported by
clicking the Export button. This will create an XML file in
VUSER_HOME/my8colors.ct with 8 color control point
entries in it. At this point, the user should exit VisIt. With a text editor,
the user can now edit the file my8colors.ct. Starting at the top of the
file where the first color control point is defined (e.g. the one closest to
the zero end of the [0...1] range), edit the position and rgb color
of the first control point to match the values in the above table. Note that
there is a 4th entry for each rgb color. This is for setting transparency of
that color in the range [0...255] where 0 is fully transparent and
255 is fully opaque. If transparency effects are not needed, this 4th
entry can be ignored and just always set equal to 255.
When VisIt is restarted, it will load this color table file. The user can then set this color table as the one to be used in various plots.
One final issue to deal with in this example is how to handle the
user’s goal of having all negative values in the input variable map
to the first color in the color table and all values greater or equal to 5000
to the last color. To do this, the user will have to define a new variable to
plot using a conditional expression of the form
if(lt(var,0),0,if(ge(var,5000),5000,var)) where var is the variable and
then use this new expression variable in place of var for the desired
behavior.
Show/Hide XML color table file
<?xml version="1.0"?>
<Object name="ColorTable">
    <Field name="Version" type="string">3.0.1</Field>
    <Object name="ColorControlPointList">
        <Object name="ColorControlPoint">
            <Field name="colors" type="unsignedCharArray" length="4">204 204 204 255 </Field>
            <Field name="position" type="float">0.0</Field>
        </Object>
        <Object name="ColorControlPoint">
            <Field name="colors" type="unsignedCharArray" length="4">102 204 255 255 </Field>
            <Field name="position" type="float">0.0006</Field>
        </Object>
        <Object name="ColorControlPoint">
            <Field name="colors" type="unsignedCharArray" length="4">102 255 102 255 </Field>
            <Field name="position" type="float">0.002</Field>
        </Object>
        <Object name="ColorControlPoint">
            <Field name="colors" type="unsignedCharArray" length="4">255 255 204 255 </Field>
            <Field name="position" type="float">0.005</Field>
        </Object>
        <Object name="ColorControlPoint">
            <Field name="colors" type="unsignedCharArray" length="4">255 255 0 255 </Field>
            <Field name="position" type="float">0.01</Field>
        </Object>
        <Object name="ColorControlPoint">
            <Field name="colors" type="unsignedCharArray" length="4">255 153 0 255 </Field>
            <Field name="position" type="float">0.02</Field>
        </Object>
        <Object name="ColorControlPoint">
            <Field name="colors" type="unsignedCharArray" length="4">255 0 0 255 </Field>
            <Field name="position" type="float">0.2</Field>
        </Object>
        <Object name="ColorControlPoint">
            <Field name="colors" type="unsignedCharArray" length="4">153 0 204 255 </Field>
            <Field name="position" type="float">1</Field>
        </Object>
        <Field name="tags" type="stringVector">"UserDefined"</Field>
    </Object>
</Object>
9.2.2. Numerically Controlled Banded Coloring
Sometimes it is convenient to create banded coloring of smoothly varying data.
For example, it is an easy way to create something akin to a contour plot.
In VisIt, it is possible to do this with either a Continuous or a Discrete color table.
In general, it is much easier with a Continuous color table (with smoothing set to None).
Trying to do the same thing with a Discrete color table requires an additional step to create a companion conditional expression which implements the non-uniform banding.
For example, given the smoothly varying variable, u, in the range [-1...+1] shown in normal (e.g. hot) Pseudocolor plot in Fig. 9.34.
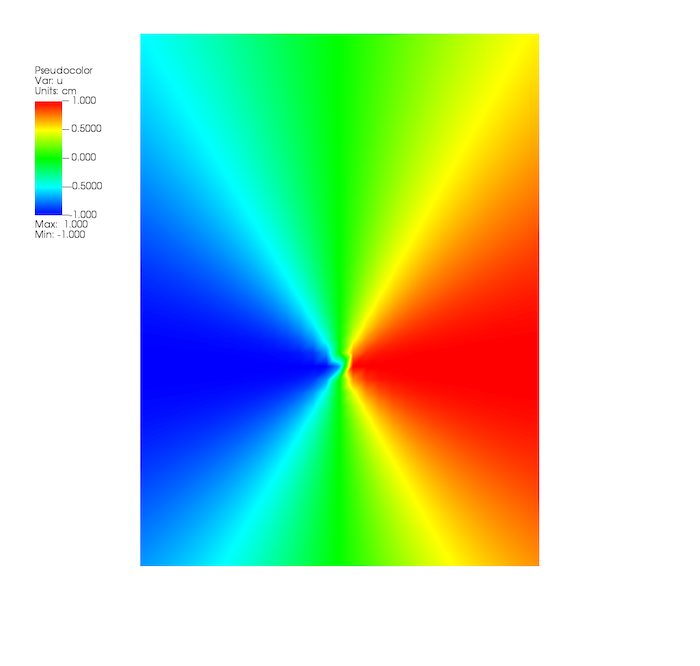
Fig. 9.34 Smoothly colored variable using hot color table.
we would like to produce a 4-color banded plot using the coloring logic below…
Values in Range |
Map to this Color |
|---|---|
-inf…-0.95 |
blue |
-0.95…0 |
cyan |
0…+0.95 |
green |
+0.95…+inf |
red |
9.2.2.1. Banded Coloring with Continuous Color Table
The input variable’s range is [-1...+1] and this range needs to be mapped into the color-table range [0...1].
This results in color table positions for the four colors to be used in the mapping table above…
Color Table Position |
Color Table Color |
|---|---|
-inf…0.0125 |
blue |
0.0125…0.5000 |
cyan |
0.5000…0.9875 |
green |
0.9875…+inf |
red |
This results in the banded coloring in Fig. 9.35
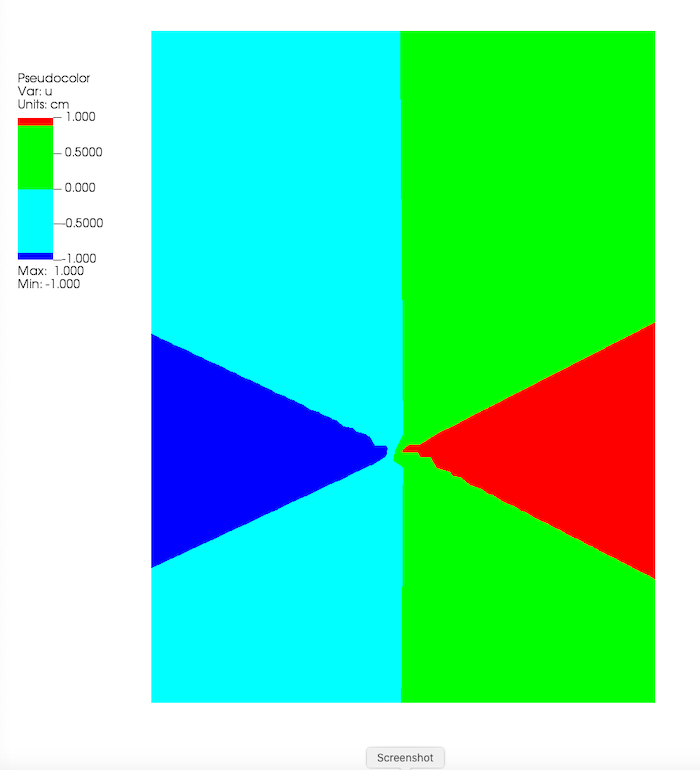
Fig. 9.35 The variable u plotted with a 4-color Continuous color table with None smoothing.
To create the color table for this result, follow the instructions for editing color control point positions numerically.
After editing the color table, re-import it back into VisIt.
Make sure the color table is Continuous and that the smoothing is set to None.
Apply this color table to the Pseudocolor plot used to plot the variable u and the same coloring as shown in the figure should be observed.
9.2.2.2. Banded Coloring with Discrete Color Table
A Discrete color table does indeed wind up banding smoothly varying data. However, the band boundaries are uniformly spaced in the variable’s range and this may not always be desirable. Sometimes, it is desirable to have finely tuned banding around specific portions of the variable’s range. This requires the coordination of a Discrete color table and an appropriately constructed conditional expression.
Using a 4-color Discrete color table alone, only the plot in Fig. 9.36 is produced.
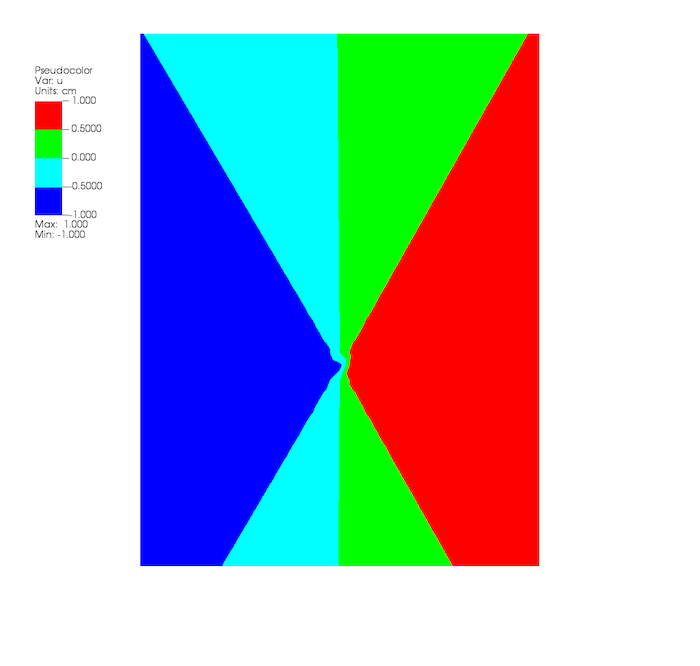
Fig. 9.36 A 4-color Discrete color table coloring alone
This is because the colors in a Discrete color table are always uniformly spaced over the variable’s value range.
To produce the desired coloring we need to use a conditional expression that maps the input variable into 4 distinct values using the range logic from the table.
In this case, the correct expression would be if(lt(u,-0.95),0, if(lt(u,0),1, if(lt(u,0.95),2,3))).
Then, plotting this expression using the 4-color Discrete color table, the desired coloring is produced as shown in
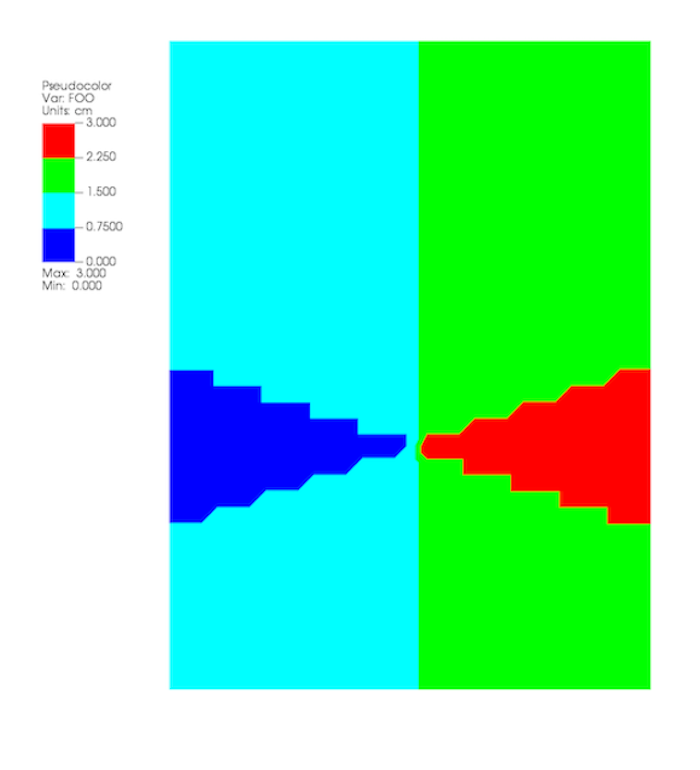
Fig. 9.37 A 4-color Discrete color table coloring combined with a conditional expression
As can be seen in the side-by-side comparison below, there is a noticeable difference between the results produced by the two approaches demonstrated here to create a banded coloring.
|
|
|
The second approach (on the right) using the combination of a Discrete color table and a conditional expression shows significantly more jagged banding. This has to do with the ordering of operations of interpolation of the variable across mesh zones and then mapping of the variable values to colors.
The first approach performs interpolation followed by mapping. The second approach effectively performs the mapping first through its use of the conditional expression replacing the smoothly varying variable with a highly discontinuous variable after which interpolation is performed. In addition, the legend (on the right) does not do a good a job conveying the mapping of the variable’s color to its values. This has to do with the use of the intermediate expression variable to help perform the mapping.
9.2.2.3. Converting color table types
It is possible to convert a continuous color table to a discrete color table and vice-versa using the Continuous and Discrete radio buttons in the editor portion of the Color table window. Changing the color table type from discrete to continuous does not change the color table’s color control points; it only changes how they are used. If you select a discrete color table and click the Continuous radio button, the color table will be changed into a continuous color table and the Editor area will change to continuous mode and show the color table in a spectrum but no color control points will have changed. You can even turn the color table back into a discrete color table and the Editor area will show the color table in discrete mode, but the color control points will not have changed.
9.2.2.4. Built-In Color Tables
VisIt 3.4 supports the notion of built-in color tables. These are color tables that are either hard coded in VisIt or appear in the resources directory. They have special rules, namely, they cannot be edited, deleted, or exported. They can, however, be copied, using the New button as discussed up above.
9.2.3. Better Color Tables
VisIt includes sets of color tables that are optimized for various properties. These color tables, although they are less well known and used, often represent better choices than the default hot color table. Some are better for consumers of visual data who have color vision deficiency (CVD) (e.g. color blindness). Some represent emerging standards used in various corners of the visualization community. In some sense, these color table choices are more inclusive in that they convey the same information to a broader segment of the population and more portable in that they work across a number of different contexts; print, projection, monitor.
9.2.3.1. The Viridis color tables
The Viridis color tables assert the following properties…
Colorful: spanning as wide a palette as possible so as to make differences easy to see.
Perceptually uniform: meaning that values close to each other have similar-appearing colors and values far away from each other have more different-appearing colors, consistently across the range of values.
Robust to colorblindness: so that the above properties hold true for people with common forms of colorblindness, as well as in grey scale printing.
These color tables all have the Color Blind Safe, Viridis, and Default tags.
9.2.3.2. The Crameri color tables
The Crameri color maps (also called the Scientific Colour Maps) assert the following properties.
Fairly representing data: perceptually uniform and ordered to represent data both fairly, without visual distortion, and intuitively.
Universally readable: The color combinations are readable both by color-vision deficient and color-blind people, and even when printed in black and white.
Citable & reproducible: The color maps and their diagnostics are permanently archived and versioned to enable upgrades and acknowledge developers and contributors.
The Crameri color tables define five broad classes of color tables…
Sequential (
seq) - good for displaying continuous numerical data.Diverging (
div) - good for displaying comparative data or data differencing.Mult-sequential (
2seq) - good for displaying multi-modal data.Cyclic (
cyc) - good for displaying periodic data.Categorical (
jumbled) - good for displaying categorical data or false contouring of smooth data.This is just a jumbling of the associated sequential color table to maximize perceptual differentiation between neighboring data values.
In addition, discrete versions consisting of 10 colors from their associated main color table are defined.
These color tables all have the Color Blind Safe and Crameri tags and are named <name>-<class>-<count> where <name> is the specific color table in the Crameri set of color tables, <class> is one of the five classes defined above and <count> is defined only for discrete color tables and indicates the number of colors in the table.
9.2.3.3. The CMOcean color tables
The cmocean color maps are designed for oceanographic variables and analysis.
These are the same set of color maps available in Python’s cmocean module for matplotlib.
These tables are all tagged with CMOcean tag and include Sequential, Diverging and/or Cyclic tags, as appropriate.
These tables are also designed to provide some degree of (~50%) color blind safety so they are also tagged Color Blind Safe.
9.2.4. Filtering With Tags
To aid with choosing a color table, VisIt has a color table tagging scheme built into the Color Table Manager. Prior to VisIt 3.4, users had to select the tag filtering check box to enable tag filtering. In VisIt 3.4, tagging is always enabled. The manager portion of the color table window is pictured below.
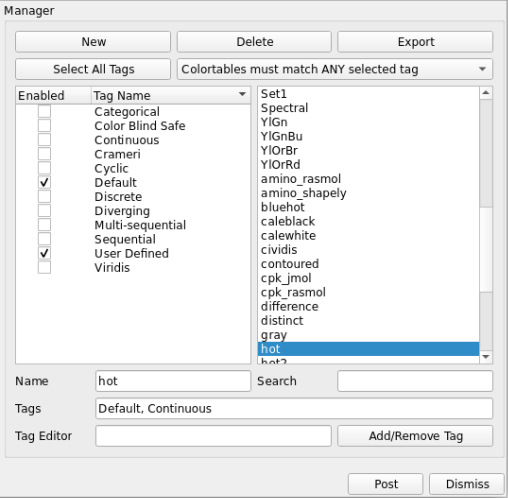
Fig. 9.38 The color table window manager is where tag filtering comes into play.
9.2.4.1. How it works
Each color table has a number of tags associated with it.
These are visible in the Tags Bar underneath the color table name.
Users can select tags from the tag list to see only color tables that have those tags.
So, for example, checking the box for the Viridis tag will cause the color table name box to show color tables that have the Viridis tag.
However, this does not just affect the color table name box.
All buttons allowing you to choose color tables will now only show color tables that match the current tag filtering selection.
An exception to this is the default continuous and default discrete color table buttons, which will further restrict the set of choosable color tables to continuous and discrete color tables respectively.
Users can also control how tags are combined: the dropdown button above the list of color table names gives users the option to have color tables match ALL of the selected tags or ANY of the selected tags.
For example, if only the Color Blind Safe and Continuous tags are selected and the dropdown is set so color tables match ANY of the selected tags, then all color tables that have either the Color Blind Safe tag or the Continuous tag will appear.
However, if you set the dropdown so color tables match ALL of the selected tags, then only color tables that have both the Color Blind Safe tag and the Continuous tag will appear.
To view the full list of color tables, users can use the Select All Tags Button while the drop down is set so color tables match ANY of the selected tags. Clicking this button while all tags are selected will deselect all tags.
9.2.4.2. Specific Behavior
By default, only the Default and User Defined tags are selected (If there are no user defined color tables, the User Defined tag will not appear in the list).
The Color Table Manager will retain the tag filtering selection even if the window is closed and reopened.
When a new color table is created, it will inherit the tags from the color table it is based on.
In addition, it will get the User Defined tag associated with it.
The same is true of color tables found in the user’s .visit directory.
When loaded into VisIt, they will automatically be assigned the User Defined tag if they do not have it already.
If VisIt encounters a color table that does not have any tags, that color table will be assigned the No Tags tag.
Exporting a color table will export its tags, so they are accessible the next time you use your color table in VisIt.
9.2.4.4. Tag Editing
With VisIt 3.4 it is possible to edit tags directly via the Color Table Window. The Tag Editor is located beneath the Tags bar. In it, you may type the name of a tag that you wish to either add or remove from the currently selected color table. To add the tag to or remove the tag from a color table, click the Add/Remove Tag button next to the Tag Editor. If the tag name you have typed is not in the list of tags associated with the current color table, then it will be added upon clicking the Add/Remove Tag button. Likewise, if the tag name you have typed is in the list of tags associated with the current color table, then it will be removed upon clicking the Add/Remove Tag button.
However, built-in color tables behave differently. With built-in color tables, it is possible to add new tags, but it is not possible to remove tags that are present by default. So you can add tags to built-in color tables at will, but you can only remove tags that you or others have added.
Adding a new tag to a color table will immediately add it to the list of tags for filtering.
Prior to VisIt 3.4, editing tags in the GUI was not supported.
To edit a color table’s tags, users must directly edit the color table’s .ct file.
If there are tags defined for that color table, they will appear in a field (usually near the end of the file) called tags.
Tags can be added to the list as desired.
VisIt generates its tag list from the color table files it reads, so creating a new tag is as easy as writing the name of the tag in a color table file in the tags field.
Another new feature of VisIt 3.4 is tag name rules. Tags must now only be comprised of alphanumeric characters, whitespace, dashes, equal signs, and greater than and less than signs.
9.2.5. Searching for Color Tables
Another option for finding the right color table is to use the search feature. With this option, users can type a search term into the Search text box, and only color tables that have a name containing that term will appear in the color table name table.
Users need only edit the search bar contents to use it. To disable searching, simply delete all text in the search bar.
Searching also works in tandem with the tagging system. So, if tagging is enabled, only results from a search which have the specified tags will appear in the color table name table.
9.2.6. Color Tables and Saving Settings/Sessions
New to VisIt 3.4 are updates to how color tables interact with saving state (saving settings and sessions). Color tables themselves will now never be saved when saving state, since built-in color tables have no changes to save, and user defined color tables are exported to the .visit directory, so there is no color table information to save when saving state. However, there are two exceptions to this: the current tag filtering selection will be preserved if state is saved, and all modifications to tags will also be saved.