9.5. View
The view is one of the most critical properties of a visualization since it determines what parts of the dataset are seen. The view is also one of the most difficult properties to set. It is not that the act of setting the view is difficult. In fact, it is quit the opposite. The problem with setting the view is finding a flattering view for a database that will continue to be a good view for the entire life of the visualization. Many plots will deform or expand over the course of an animation and you have to decide how to pick a good view. You can pick a view that is zoomed way out and then let your plots expand and deform until they make good use of the visualization window. You can also decide to keep changing the view throughout the animation. A common technique is to interpolate views or do some sort of fly-by animation when the plots in the animation are expanding or not behaving in a static manner. The fly-by animation is used to distract the audience from the fact that you need to change to a more suitable view.
The view in VisIt can be set in two different ways. The first and best way to set the view is to navigate to it interactively in the visualization window. This is the fastest and most direct way of setting the view. The problem with setting the view in this manner is that it is not very reproducible. It is often the case that users want to look at the same feature in their database using the same view. VisIt provides a View Window that they can use to set the view information exactly the same every time.
9.5.1. View Window
You can open the View Window by selecting View from the Main Window’s Controls menu. The View Window is divided into five tabbed sections. The first tab sets the curve view, the second tab sets the 2D view, the third tab sets the 3D view, the fourth tab sets the axis array view, and the last tab sets advanced view options. The View Window also contains a Command text field at the bottom for entering view commands.
9.5.1.1. Setting the curve view
Visualization windows that contain Curve plots use a special type of view known as a curve view. A curve view consists of: viewport, domain, and range. The viewport is the area of the visualization window that will be occupied by the plots and is specified using X and Y values in the range [0,1]. The point (0,0) corresponds to the lower-left corner of the visualization window while the point (1,1) corresponds to the visualization window’s upper-right corner. To change the viewport, type new numbers into the Viewport text field on the Curve view tab of the View Window (Figure 9.48). The minimum and maximum X values should come first, followed by the minimum and maximum Y values.
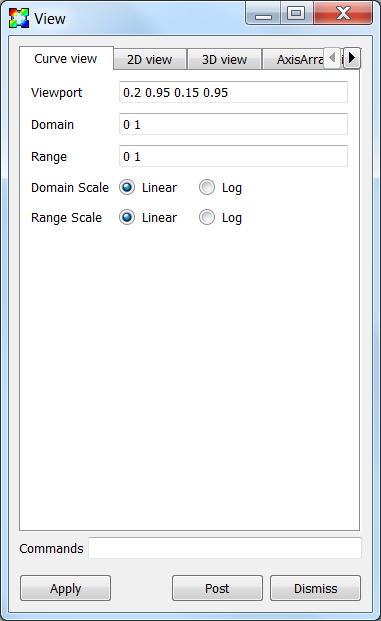
Fig. 9.48 The curve view options
The domain and range refer to the limits on the X and Y axes. You can set the domain, which is the range of X values that will be displayed in the viewport, by typing new minimum and maximum values into the Domain text field. You should use domain values that use the same dimensions as the Curve plot that will be plotted in the visualization window. You can set the range, which is the range of Y values that will be displayed in the viewport, by typing new values into the Range text field. The domain and range values may also be log scaled and may be controlled independently. To log scale the domain, check the Log radio box to the right of the Domain Scale label. To log scale the range, check the Log radio box to the right of the Range Scale label.
9.5.1.2. Setting the 2D view
Setting the 2D view is conceptually simple. There are only two pieces of information that you need to supply. The first piece of information that you must enter is the viewport, which is an area of the visualization window in which you want the 2D plots to appear. Imagine that the lower left corner of the visualization window is the origin of a coordinate system and that the upper left and lower right corners both have values of 1. Every point in the visualization window can be characterized as a Cartesian coordinate where both values in the coordinate are in the range [0,1]. The viewport is specified by entering four numbers in the form x0 x1 y0 y1 where x0 is the leftmost X value, x1 is the rightmost X value, y0 is the lower Y value, and y1 is the upper Y value that will be used in the viewport. The window is an area in the space occupied by the 2D plots. You can start with a window that is the same size as the plot’s spatial extents and then zoom in from there by making the window values smaller and smaller. The window values are also of the form x0 x1 y0 y1. To change the 2D view, type new values into the Viewport and Window text fields on the View Window’s 2D view tab (Figure 9.49).
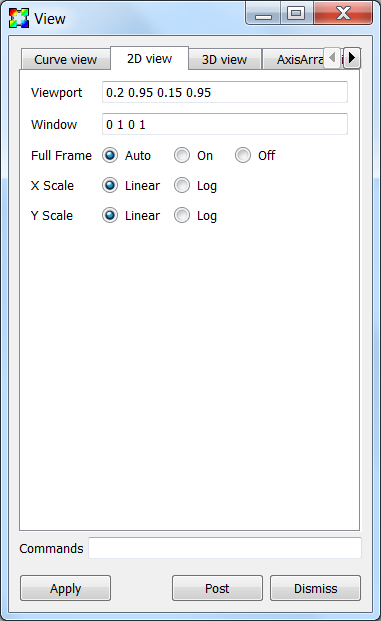
Fig. 9.49 The 2D view options
Some databases yield plots that are so long and skinny that they leave most of the visualization window blank when VisIt displays them. A common example is equation of state data, which often has at least 1 exponential dimension. VisIt provides Fullframe mode to stretch long, skinny plots so they fill more of the visualization window so it is easier to see them. It is worth noting that Fullframe mode does not preserve a 1:1 aspect ratio for the displayed plots because they are stretched in each dimension so they fit better in the visualization window. To activate full frame mode, click on the Auto or On radio buttons to the left of the Full Frame label. When full frame mode is set to Auto, VisIt determines the aspect ratio of the X and Y dimensions for the plots being visualized and automatically scales the plots to fit the window when extents for one of the dimensions are much larger than the extents of the other dimension.
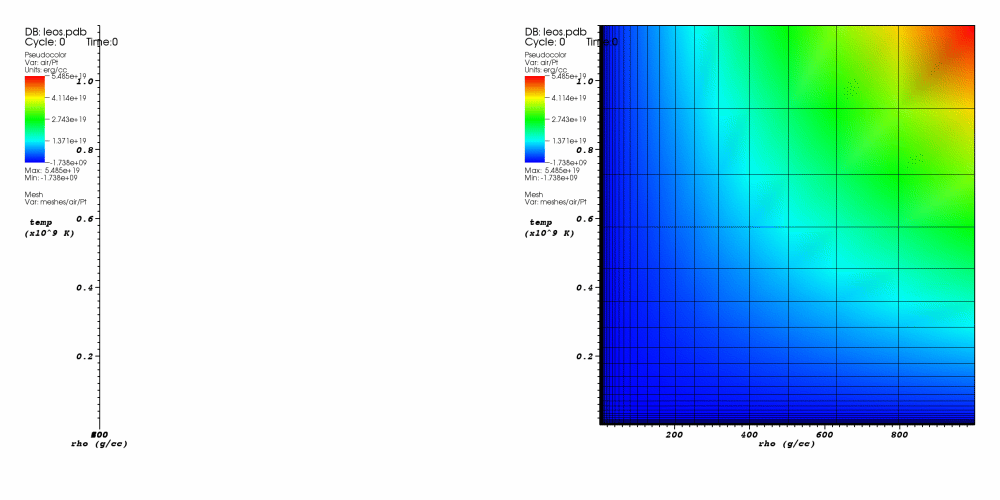
Fig. 9.50 The effect of full frame mode on an extremely skinny plot
Just like the with the curve view, the x and y values may be log scaled independently. To log scale the x values, check the Log radio box to the right of the X Scale label. To log scale the y values, check the Log radio box to the right of the Y Scale label.
9.5.1.3. Setting the 3D view
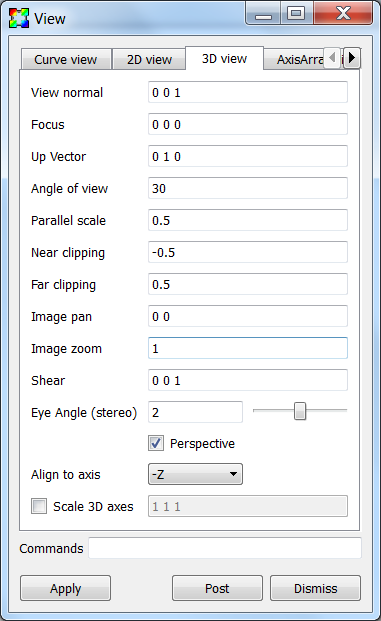
Fig. 9.51 The 3D view options
Setting the 3D view using controls in the View Window’s 3D view tab (see Figure 9.51) demands an understanding of 3D views. A 3D view is essentially a location in space (view normal) looking at another location in space (focus) with a cone of vision (view angle). There are also clipping planes that lie along the view normal that clip the near and far objects from the view. Figure 9.52 depicts the various components of a 3D view.
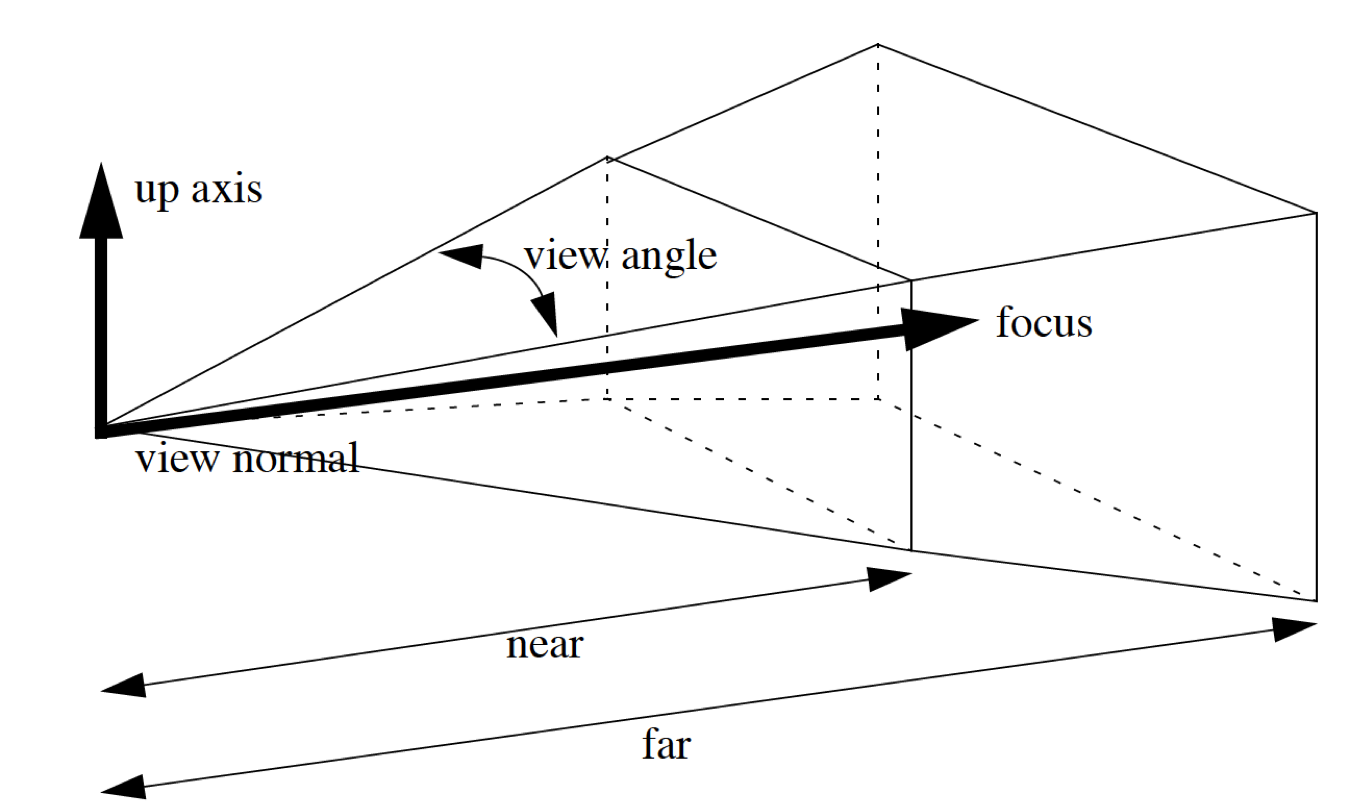
Fig. 9.52 The 3D perspective view volume
To set the 3D view, fill in the following fields:
- View normal
Where you want to look from.
- Focus
What you want to look at.
- Up axis
Determines which way is up. A good default value for the up axis is 0 1 0. VisIt will often calculate a better value to use for the up axis so it is not too important to figure out the right value.
- View Angle
Determines how wide the field of view is. The view angle is specified in degrees and a value around 30 is usually sufficient.
- Near clipping and Far clipping
Values along the view normal that determine where the near and far clipping planes are to be placed. It is not easy to know that good values for these are so you will have to experiment.
- Parallel scale
Acts like a zoom factor that zooms the camera towards the focus. For a parallel projection, it is half the height of an object in the window. For example, if you had a sphere of radius 10, setting the parallel scale to 10, would result in the top and bottom of the sphere touching the top and bottom of the image. Where the sphere touches on the left and right edges depends on the aspect ratio of the image. If it was 1:1, then the sphere would also touch the left and right edges of the image. When doing a perspective projection, it attempts to have the top and bottom of the sphere touch the top and bottom of the image.
- Perspective
Applies to 3D visualizations and it causes a more realistic view to be used where objects that are farther away are drawn smaller than closer objects of the same size. VisIt uses a perspective view for 3D visualizations by default.
VisIt supports stereo rendering, during which VisIt draws the image in the visualization window twice with the camera eye positioned in slightly different locations to mimic the differences in images seen by your left eye and your right eye. With the right stereo goggles, the image that you see appears to hover in 3D space within your monitor since the effect of the stereo image adds much more depth to the visualization. You can set the angle that VisIt uses to separate the cameras used to draw the images by typing a new angle into the Eye angle text field or by using the Eye angle slider.
The Align to axis menu provides a convenient way to get side, top, and bottom views of your 3D data. It provides six options corresponding to the six axis aligned directions and sets both the View normal and the Up vector.
9.5.1.4. Setting the axis array view
Visualization windows that contain Parallel Coordinate plots use a special type of view known as an axis array view. An axis array view consists of: viewport, domain, and range. The viewport is the area of the visualization window that will be occupied by the plots and is specified using X and Y values in the range [0,1]. The point (0,0) corresponds to the lower-left corner of the visualization window while the point (1,1) corresponds to the visualization window’s upper-right corner. To change the viewport, type new numbers into the Viewport text field on the Curve view tab of the View Window (Figure 9.53). The minimum and maximum X values should come first, followed by the minimum and maximum Y values.
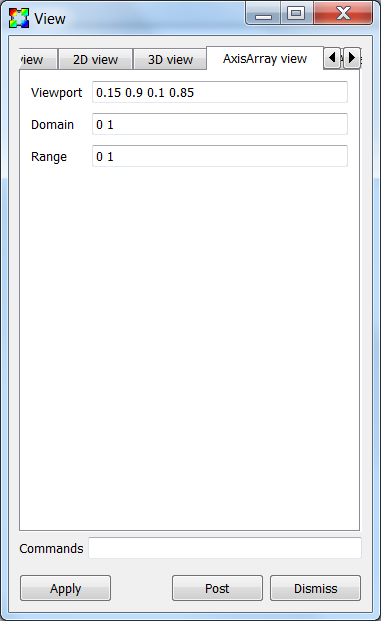
Fig. 9.53 The axis array view options
The Domain and Range settings are not very intuitive and we will give a short description followed by some examples. The domain controls the position and spacing of the parallel axes. The larger the value the more tightly they are spaced or the more axes that will fit in the view. For example, a domain of 0. to 2. would have room for exactly three coordinate axes, with the first one at the extreme left edge of the viewport and the third one at the extreme right edge of the viewport. Changing the domain to 1. to 3. would shift the second axis to the extreme left edge of the viewport and move the third axis to the center of the viewport. If there were only three axes, then the right half of the viewport would be empty. The range controls the height of the coordinate axes. The larger the value, the shorter the axes. For example, the default range of 0. to 1. results in the axes filling the height of the viewport. A range of 0. to 2. results in the axes filling the bottom half of the viewport. You can play with the controls to get a better understanding of the domain and range settings.
9.5.1.5. Advanced view features
The View Window’s Advanced tab, shown in Figure 9.54, contains advanced features that are not needed by all users.
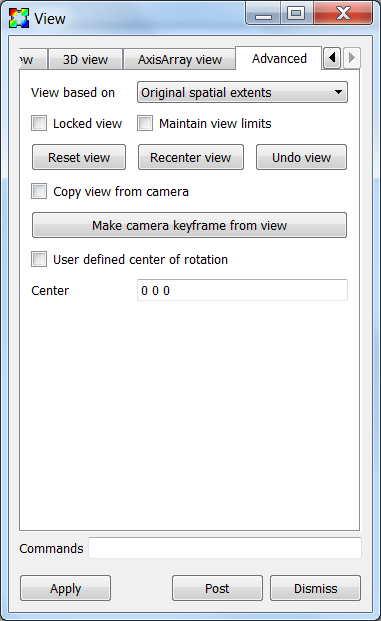
Fig. 9.54 The advanced view options
The View based on menu is used to specify if the view is set based on the original spatial extents of the plot or the actual current extents which are the plot’s current extents after it has been subsetted in some way. By default, VisIt bases the view on the plot’s original extents which leaves the remaining bits of a plot, after being subsetted, in the same space as the original plot. This makes it easy to see where the remaining pieces of the plot were situated relative to the whole plot but it does not always make best use of the visualization window. To fill up more of the visualization window, you might want to base the view on the actual current extents by selecting Actual current extents from the View based on menu.
When using more than one visualization window, such as when comparing plots using two different databases side by side, it is often useful for the plots being compared to have the same view. VisIt allows you to lock the views together for the multiple visualization windows so that when you change the view of any window whose view is locked, all other windows with locked views get the new view. To lock the view for a visualization window, click the Locked view check box or click on the Toolbar button to lock views.
Normally, VisIt will adjust the view to match the extents of the data. For example, if you are looking at data from a simulation whose extents expand over time, VisIt will automatically adjust the view so that the data fills roughly the same amount of space as the extents expand. Another example is when the extents move from left to right, VisIt will adjust the view so that the extents are always centered in the same portion of the screen. This behavior is not always desired in certain situations. To turn off this behavior and fix the view, no matter how the extents of the data change, click on the Maintain view limits check box.
The Reset view, Recenter view, and Undo view can be used to reset the view, recenter the view, and undo the last view change. Resetting the view resets all aspects of the view based on the data extents. Recentering the view resets all aspects of the view except the view orientation based on the data extents. Undoing the view returns the view to the last view setting. The last 10 views are stored so you can undo the view up to 10 times.
The Locked view check box, the Maintain view limits check box, the Reset view button, the Recenter view button, and Undo view buttons behave differently than the rest of the controls in the view window in that they effects take effect immediately, without having to press the Apply button.
The Copy view from camera check box and the Make camera keyframe from view button are deprecated and will be removed in the next release.
The center of rotation is the point about which plots are rotated when you set the view. You can type a new center of rotation into the Center text field and click the User defined center of rotation check box if you want to specify your own center of rotation. The center of rotation is, by default, the center of your plots’ bounding box. When you zoom in to look at smaller plot features and then rotate the plot, the far away center of rotation causes the changes to the view to be large. Large view changes when you are zoomed in often make the parts of the plot that you were inspecting go out of the view frustum. If you are zoomed in, you should pick a center of rotation that is close to the surface of the plot that you are inspecting. You can also pick a center of rotation using the Choose center from the visualization window’s Popup menu.
9.5.1.6. Using view commands
The Commands text field at the bottom of the View Window allows you to enter one or more semi-colon delimited legacy MeshTV commands to change the view. The following list has a description of the supported view commands:
- pan x y
Pans the 3D view to the left/right or up/down. The x, y arguments, which are floating point fractions of the screen in the range [0,1], determine how much the view is panned in the X and Y dimensions.
- pan3 x y
Same as pan.
- panx x
Pans the 3D view left or right. The x argument is a floating point fraction of the screen in the range [0,1].
- pany y
Pans the 3D view up or down. The y-argument is a floating point fraction of the screen in the range [0,1].
- ytrans y
Same as pany.
- rotx x
Rotates the 3D view about the X-axis x degrees.
- rx x
Same as rotx.
- roty y
Rotates the 3D view about the Y-axis y degrees.
- rotz z
Rotates the 3D view about the Z-axis z degrees.
- rz z
Same as rotz.
- zoom val
Scales the 3D zoom factor. If you provide a value of 2.0 for the val argument, the object being viewed will appear twice as large. A value of 0.5 for the val argument will make the object appear only half as large.
- zf
Same as zoom.
- zoom3
Same as zoom.
- vp x0 x1 y0 y1
Sets the window, which is how much space relative to the plot will be visible inside of the viewport, for the 2D view. All arguments are floating point numbers that are in the same range as the plot extents. The x0 and x1 arguments are the minimum and maximum values for the edges of the window in the X dimension. The y0 and y1 arguments are the minimum and maximum values for the edges of the window in the Y dimension.
- wp x0 x1 y0 y1
Sets the window, which is how much space relative to the plot will be visible inside of the viewport, for the 2D view. All arguments are floating point numbers that are in the same range as the plot extents. The x0 and x1 arguments are the minimum and maximum values for the edges of the window in the X dimension. The y0 and y1 arguments are the minimum and maximum values for the edges of the window in the Y dimension.
- reset
Resets the 2D and 3D views.
- recenter
Recenters the 3D view.
- undo
Changes back to the previous view.