16.6. Rendering Options Window
The Rendering options window (shown in Figure 16.4) contains controls that set global options that affect how the plots in the active visualization window are drawn, as well as, look at information related to the performance of the graphics hardware VisIt is running on. The Rendering options window can be brought up by selecting Rendering from the Main window’s Preferences menu. The Rendering options window contains three tabs. The Basic tab contains basic rendering options, the Advanced tab contains advanced rendering options, and the Information tab contains information about the rendering performance of the graphics hardware VisIt is running on.
16.6.1. Basic Rendering Options
The Antialiasing, and Specular lighting options are covered in the Making It Pretty chapter.
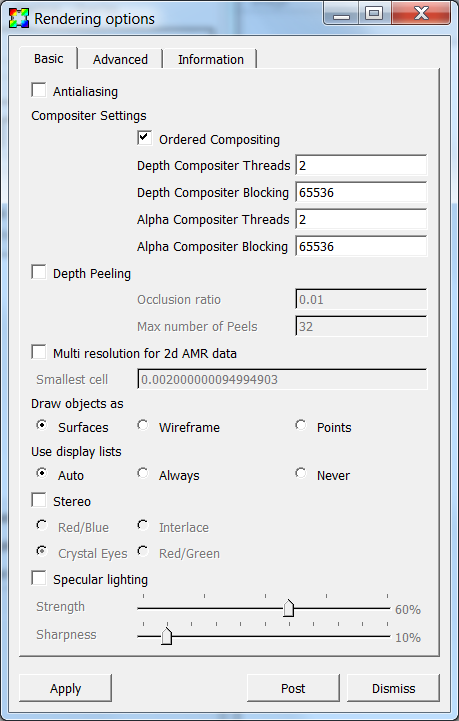
Fig. 16.4 The basic rendering options
16.6.1.1. Stereo images
Stereo images, which are composites of left and right eye images, can convey additional depth information that cannot be expressed by images that are generated using a single eye point. VisIt provides four forms of stereo images: red/blue, red/green, interlace, and crystal eyes. A red/blue stereo image (see Figure 16.5) is similar to frames from early 3D movies in that it appears stereo only when using red/blue stereo glasses. Unfortunately, red/blue stereo images are not very useful for visualization because colors are lost since most of the color ends up in the magenta range when the red and blue color channels are merged. Red/green stereo suffers a similar color loss. Interlaced images alternate lines in the image with left and right eye views so that squinting makes the image look somewhat 3D. VisIt’s crystal eyes option requires the use of special virtual reality goggles for images to appear to be 3D but this option is by far the best since it allows interactive frame rates with images that really appear to stand out from the computer monitor. VisIt does not use stereo imaging by default since it makes images draw slower because an image must be drawn for both the left eye and the right eye. To enable stereo images, check the Stereo check box. To change the type of stereo images generated, click on either the Red/Blue, Interlace, Crystal Eyes or Red/Green radio boxes under the Stereo check box.
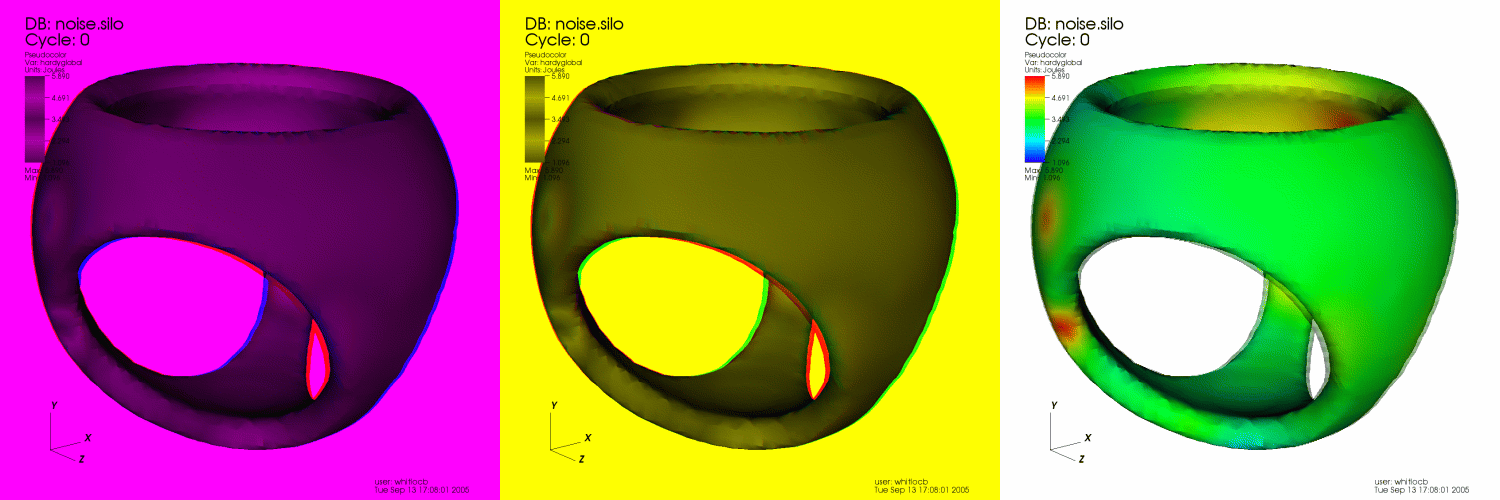
Fig. 16.5 Some various stereo image types
16.6.2. Advanced Rendering Options
The Shadows, and Depth Cueing options are covered in the Making It Pretty chapter.
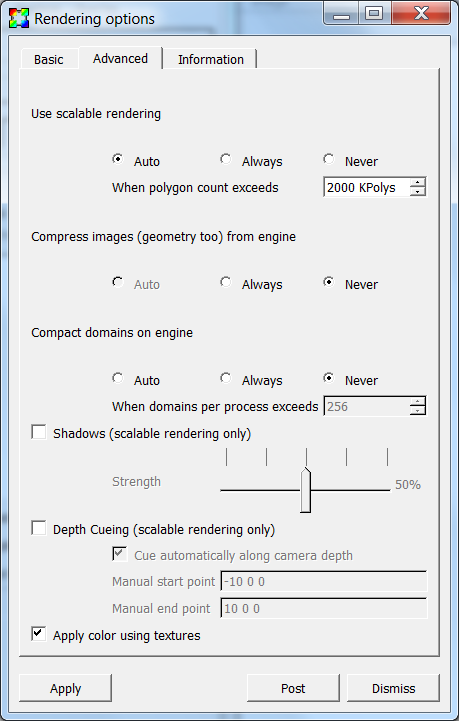
Fig. 16.6 The advanced rendering options
16.6.2.1. Scalable rendering
VisIt typically uses graphics hardware on the local computer to very quickly draw plots once they have been generated by the compute engine. This becomes impractical for very large databases because the amount of memory needed to store the graphics commands that draw the plots quickly exceeds the amount of memory in the graphics hardware. Large sets of graphics commands can also degrade performance when they must be shipped over slow networks from the compute engine to the VisIt’s viewer. VisIt provides a scalable rendering option that can improve both of these situations by creating the actual plot images, in parallel, on the compute engine, compressing them, and then transmitting only an image to the viewer where the image can be displayed.
Scalable rendering can be orders of magnitude faster for large databases than VisIt’s conventional image drawing strategy because large databases are typically processed using a parallel compute engine. When using scalable rendering with a parallel compute engine, VisIt is able to draw small pieces of the plot on each processor in parallel and then glue the image together before sending it to the viewer to be displayed. Not only has the image likely been created faster, but the size of the image is usually on the order of a megabyte instead of the tens or hundreds of megabytes needed to transmit graphics commands, which results in faster transmission of the image to the viewer. The drawback of scalable rendering is that it is usually not as interactive as graphics hardware because each time the view is changed or some other change is made to the plots, the image must be resent to the viewer over the network.
VisIt can automatically determine when to stop sending geometry to the viewer in favor of sending scalably rendered images. The scalable rendering threshold determines when VisIt switches between sending geometry and doing scalable rendering. The threshold is based on the number of polygons to be rendered. The scalable rendering threshold can be changed by entering a new number of polygons into the When polygon count exceeds spin box. The number is specified in thousands of polygons.
It is also possible to have VisIt always or never use scalable rendering. To change the scalable rendering mode, click on either the Auto, Always or Never radio boxes under the Use scalable rendering label.
16.6.3. ANARI Rendering

Fig. 16.7 ANARI rendering options
If VisIt is built with ANARI support by using the --anari option when building from source, the ANARI rendering section will appear in the Rendering options window under the Advanced tab.
Once Anari Rendering is enabled, all surface rendering will be done using ANARI.
This section contains options for controlling the ANARI rendering system.
16.6.3.1. Back-end
This option allows you to specify any ANARI supported back-end like NVIDIA VisRTX.
The back-end is a library that implements the ANARI API and must be on your library path.
You can specify environment if you’ve exported the ANARI_LIBRARY environment variable with the name of theback-end (e.g., export ANARI_LIBRARY=visrtx).
A list of supported back-ends and publicly available applications using ANARI can be found here.
Note
ANARI back-ends are a software construct. Because ANARI abstracts away the details of an entire rendering system, the underlying hardware which a back-end may use is entirely up to the implementation. Please read your vendor’s back-end documentation to see what parameters are available to configure and what underlying hardware is both available and used to render frames.
16.6.3.2. Back-end Subtype
This option allows you to specify the subtype of the back-end to use if supported by the back-end. The default option is most common and supported by all of the back-ends.
16.6.3.3. Renderer
This option allows you to specify the renderer to use with the back-end. Different renderers implement different algorithms, extensions, and support different materials. Every ANARI back-end offers a default renderer. See the vendor’s documentation for details on the available renderers and their capabilities.
16.6.3.4. Other Options
These options are specific to the Back-end and Renderer you are using and are generated at runtime. Hovering the mouse over the option label will show you a tooltip with more information. For more detailed information on the options, please refer to the vendor’s documentation.
16.6.4. Rendering Information
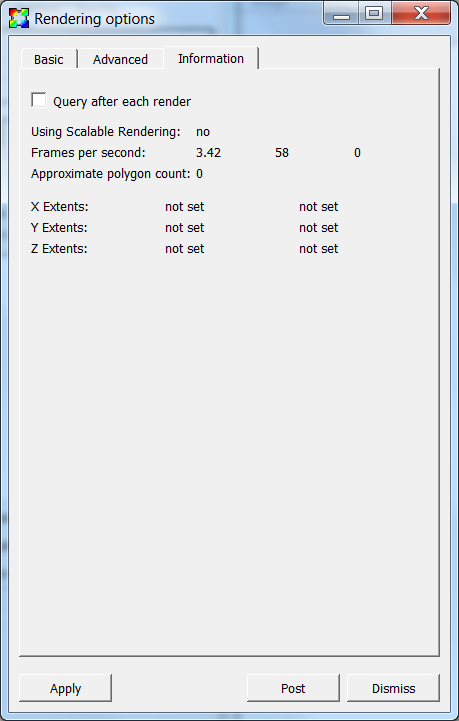
Fig. 16.8 The rendering information
16.6.4.1. Scalable rendering
The scalable rendering indicates if the compute engine used scalable rendering to render the image displayed in the viewer. The use of scalable rendering is indicated next to the Use Scalable Rendering: label.
16.6.4.2. Frames per second
The frames per second refers to the number of times that VisIt can draw the plots in the visualization window in the course of a second. VisIt displays the minimum, average, and maximum frame rates achieved during the last draw operation, like rotating the image with the mouse. They are displayed next to the Frames per second: label. Some actions that force a redraw do not cause the information to update. An example of this is resizing the visualization window. To make VisIt update the frame rate information after each time it draws the plots in the visualization window, check the Query after each render check box.
16.6.4.3. Polygon count
The polygon count refers to the number of polygons used to represent the plots in the visualization window. VisIt displays the polygon count next to the Approximate polygon count: label.
16.6.4.4. Plot extents
The plot extents are the minimum and maximum locations of the plot in each spatial dimension. The plot extents are the smallest bounding box that can contain the plots in the visualization window. VisIt displays the plot extents for each dimension next to the X Extents:, Y Extents: and Z Extents: labels. .