3.2.6. Label Plot
The Label plot, shown in Figure 3.25, can display mesh information, scalar fields, vector fields, tensor fields, array variables, subset names, and material names. The Label plot is often used as a debugging device for simulation codes since it allows the user to see labels containing the exact values at the computational mesh’s nodes or cell centers. Since the Label plot’s job is to display labels representing the computational mesh or the fields defined on that mesh, it does not convey much information about the actual mesh geometry. Since having a Label plot by itself does not usually give enough information to understand the plotted dataset, the Label plot is almost always used with other plots.
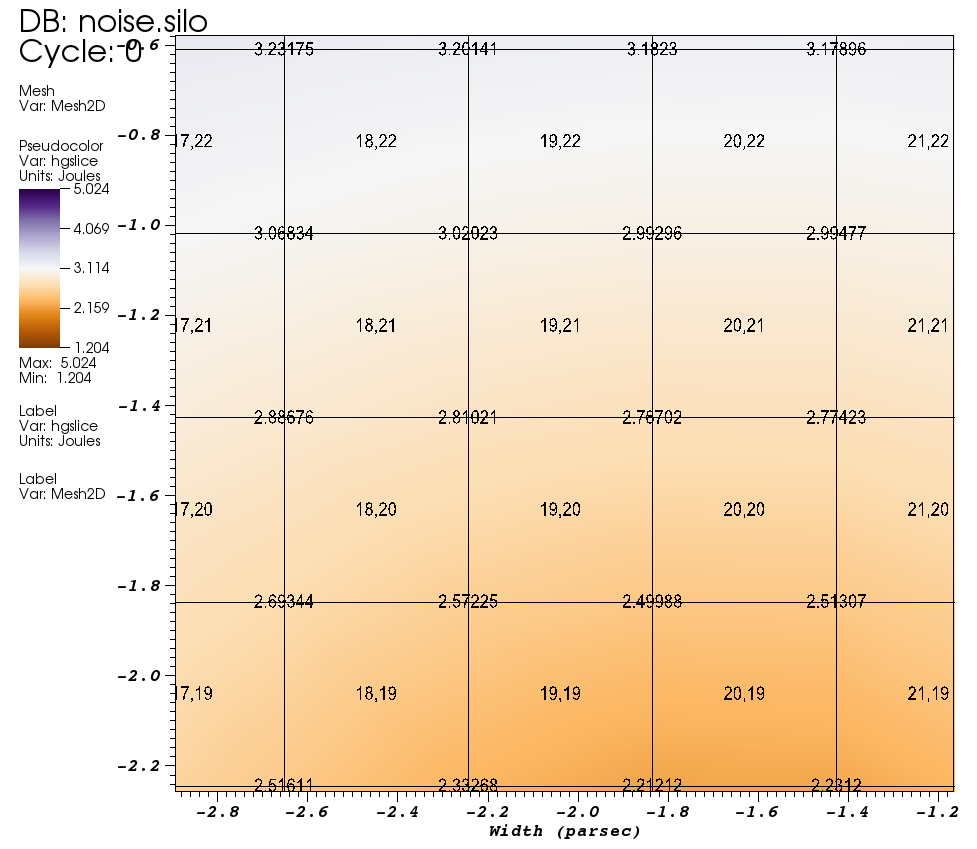
Fig. 3.25 Label plot of the mesh overlayed on Pseudocolor and Mesh plots
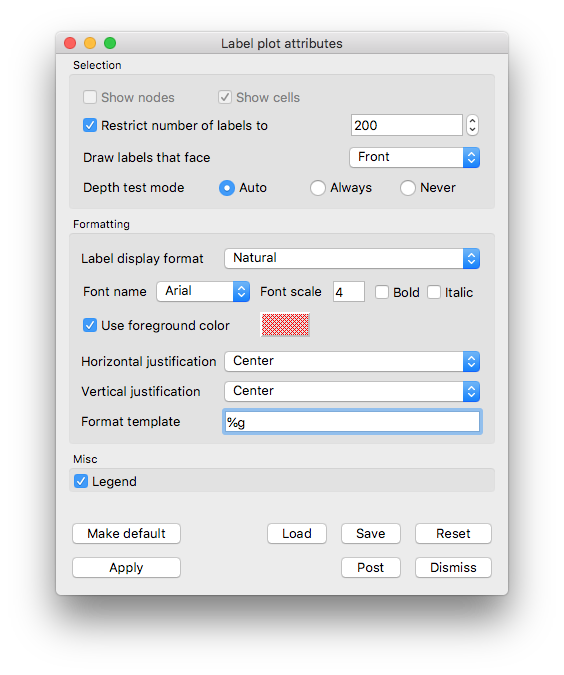
Fig. 3.26 Label plot attributes window
3.2.6.1. Choosing the Label plot’s variable
You can choose the Label plot’s variable using the Variable menu under the Plot list the same way as you would with any other type of plot. One special property that distinguishes the Label plot from some of VisIt’s other plots is that it can plot multiple types of variables. The Label plot can display information for meshes, scalars, vectors, tensors, array variables, subsets, and materials so you will typically find more variables available for the Label plot than you would for other plots. When you choose a mesh variable for the Label plot, you can display both the mesh node numbers and cell numbers otherwise you are limited to displaying only the variable being plotted.
3.2.6.2. Showing node and zone numbers
The Label plot can display the node and cell numbers for the computational mesh if you have selected a mesh variable to plot. By default, the Label plot will display cell numbers only. The cell numbers will be displayed in the format most natural to the underlying mesh representation, which means that unstructured meshes will have cell numbers that are displayed as single integers while structured meshes will be displayed in i,j,k format when possible. If you want the Label plot to show a mesh’s node numbers in addition to its cell numbers, you can click on the Show nodes check box. If you no longer want the Label plot to show the mesh’s cell numbers, you can turn off the Show cells check box.
3.2.6.3. Restricting the number of labels
Most computational meshes contain many thousands, millions, or even billions of nodes and cells. Adding that many labels would quickly become burdensome on the computer and would result in a Label plot so dense that individual labels could no longer be read or even associated with their cell or node.
VisIt’s Label plot restricts the number of labels by default to some user-settable number of labels that can comfortably fit on the screen. The method used to restrict the number of labels differs for 2D and 3D plots. For 2D plots, the viewable portion of world space is periodically subdivided, based on the zoom level, into some number of bins to which labels are then assigned. As you zoom in on the Label plot, labels that go beyond the viewport are no longer drawn and new labels that were previously hidden take their place. This allows the Label plot to efficiently draw many labels without crowding the labels on top of each other. For 3D plots, the Label plot divides up the screen into a user-settable number of bins. All label coordinates are transformed so that they can be assigned to a screen bin and the label wins the screen bin if it is closer than the label that was previously in the bin. This ensures that a small subset of all possible labels is drawn and that they do not usually overlap on the screen. If you find that the labels appear to be from the back of the mesh instead of from the front, it’s quite possible that the normals generated for your mesh were inverted for some reason. To combat this problem, select Back or Front or Back from the Draw labels that face menu.
If you want to set the number of labels that the Label plot will draw, you can type in a new value into the spin box next to the Restrict number of labels to check box or use the up and down arrows on the spin box. If you want to force the Label plot to draw all labels, you can turn off the Restrict number of labels to check box. Sometimes making the Label plot draw all of the labels can be faster than drawing a subset of labels.
3.2.6.4. Depth testing for 3D Label plots
When VisIt draw plots in the visualization window, the plots’ geometries often correspond to only the outer surfaces of the originating datasets when those datasets are 3D. This means that the majority of plots consist of convex geometry and the normal test for only drawing labels that face front is often adequate to remove any labels that appear on faces that point away from the current camera. Some plots have geometries that consist of many concave regions, which the afore-mentioned test does not handle well. Plots with concave geometries will often have various pieces be incorrectly visible because though the surfaces may face the camera, they may be obscured by other geometry. When VisIt’s Label plot draws 3D geometry, it tries to enable additional depth testing to prevent front-facing labels in back of other surfaces from being drawn. Depth testing can degrade performance so, by default, it is allowed only when you are running VisIt on your local workstation. You can set the Label plot’s depth test mode to tell VisIt when to enable depth testing. To change the values for the depth test mode, click on one of the Auto, Always, Never radio buttons to the right of the Depth test mode label. If VisIt wants to use depth testing but is not allowed to then a warning message will be issued and you can set the depth test mode to Always.
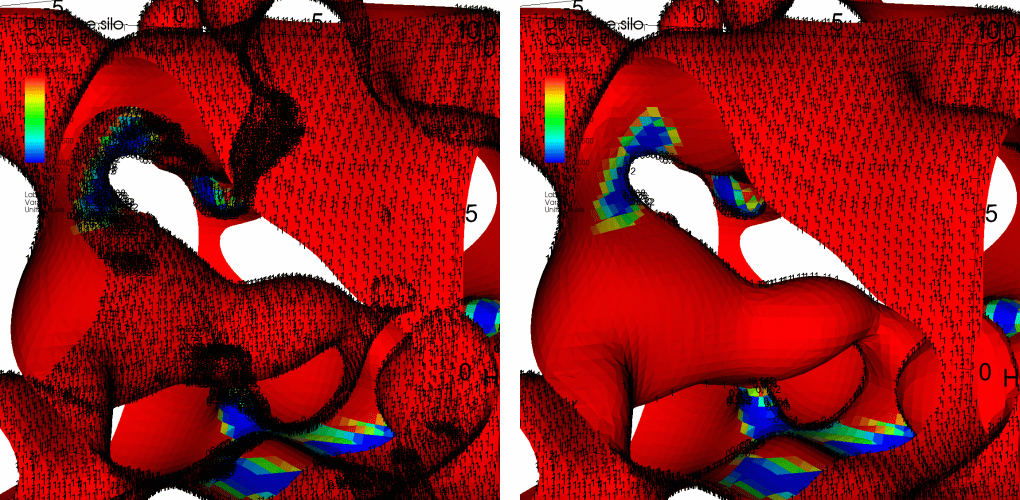
Fig. 3.27 Removing extra labels (left) with depth test (right)
3.2.6.5. Formatting labels
The Label plot provides several options for setting label format. First and foremost, you can set the label display format, which is how mesh node and cell numbers are displayed. By default, the Label plot will display labels in their most appropriate format with cell and node numbers for structured meshes displayed as logical i,j,k indices. Setting the label format is only possible for Label plots of structured meshes. To change the label format, select a new option from the Label display format menu.
The Label plot’s default behavior is to use the vis window’s foreground color but if you want labels to be a specific color, you can turn off the Use foreground color check box and select a new label color by clicking on the Label color color button.
The Label plot also allows control over the font used for the labels. Font name menu allows you to choose from among Arial, Courier and Times options. The labels can be bold or italic by checking the appropriate check boxes. Font scale is used to control the font size.
Note that when you are plotting a mesh variable, VisIt will make more controls in the Label plot attributes window so you can set color and font options for cells and nodes independently (see Figure 3.28).
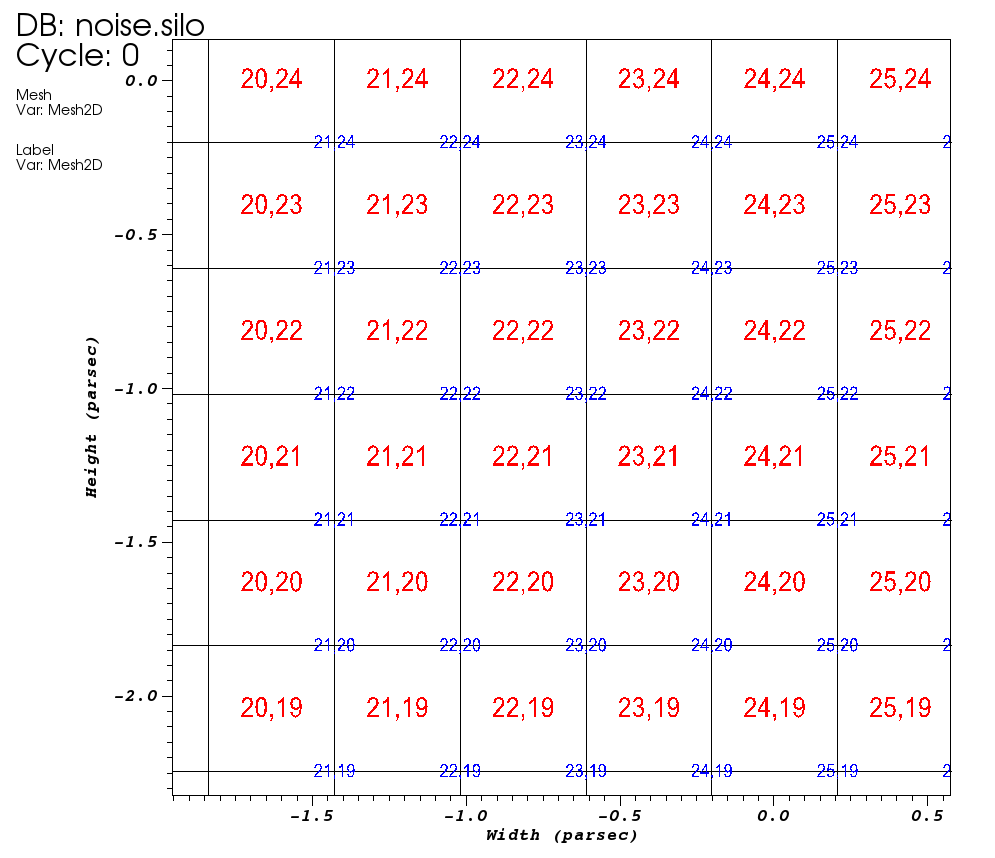
Fig. 3.28 Displaying cell and node labels with different colors
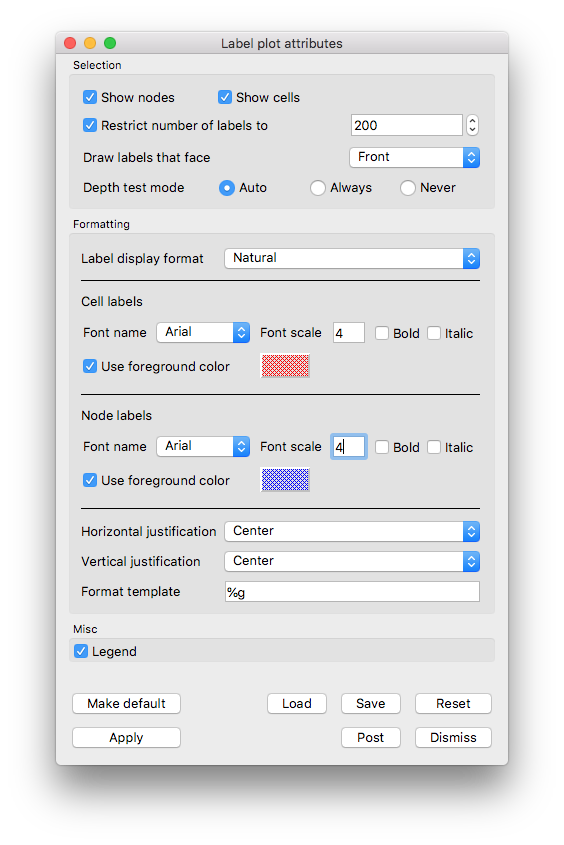
Fig. 3.29 The Label plot attributes window specifying different colors for cell and node labels
Finally, the Label plot attributes window provides controls to determine the horizontal and vertical text justification used when drawing each label. To change the horizontal text justification, select a new value from the Horizontal justification menu. To change the vertical text justification, select a new value from the Vertical justification menu.
3.2.6.6. Labeling subset names and material names
The Label plot can label subset names and material names in addition to meshes and fields defined on those meshes. To add subset names or material names to your visualization, be sure to create a Label plot using a variable of either of those types. An example of a Label plot of material names is presented in Figure 3.30.
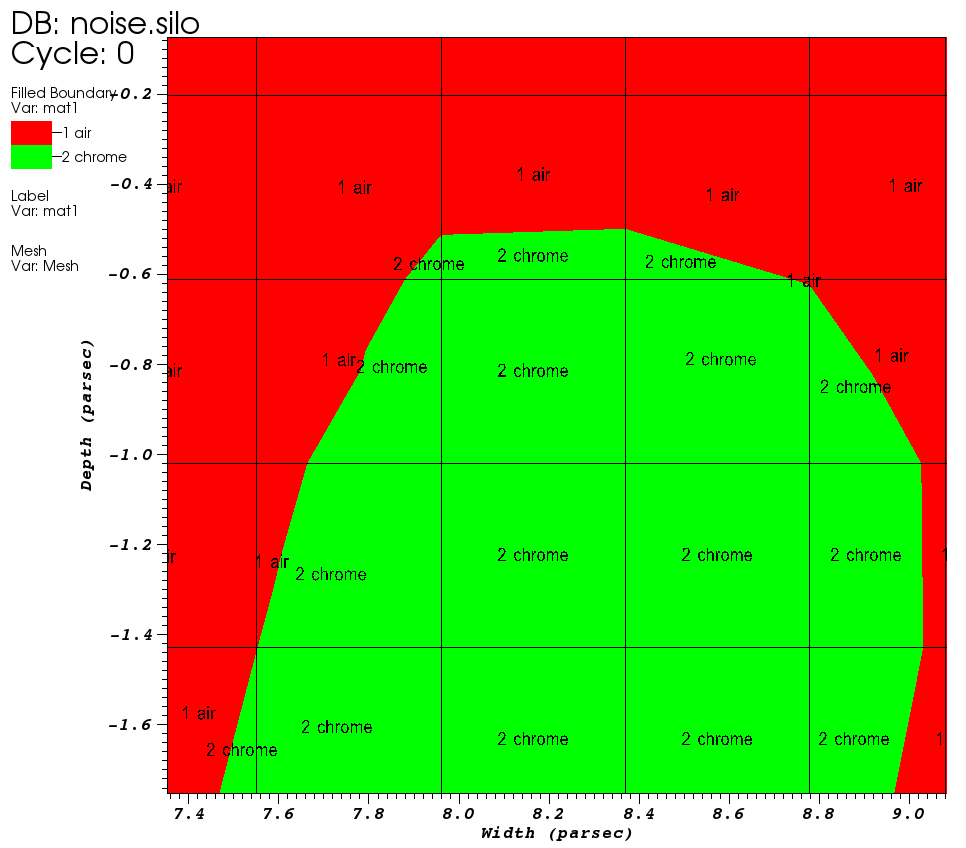
Fig. 3.30 Label plot of materials