3.2.7. Mesh Plot
The Mesh plot, shown in Figure 3.31, displays the computational mesh over which a database’s variables are defined. The mesh plot is often added to the visualization window when other plots are visualized to allow individual cells to be clearly seen.
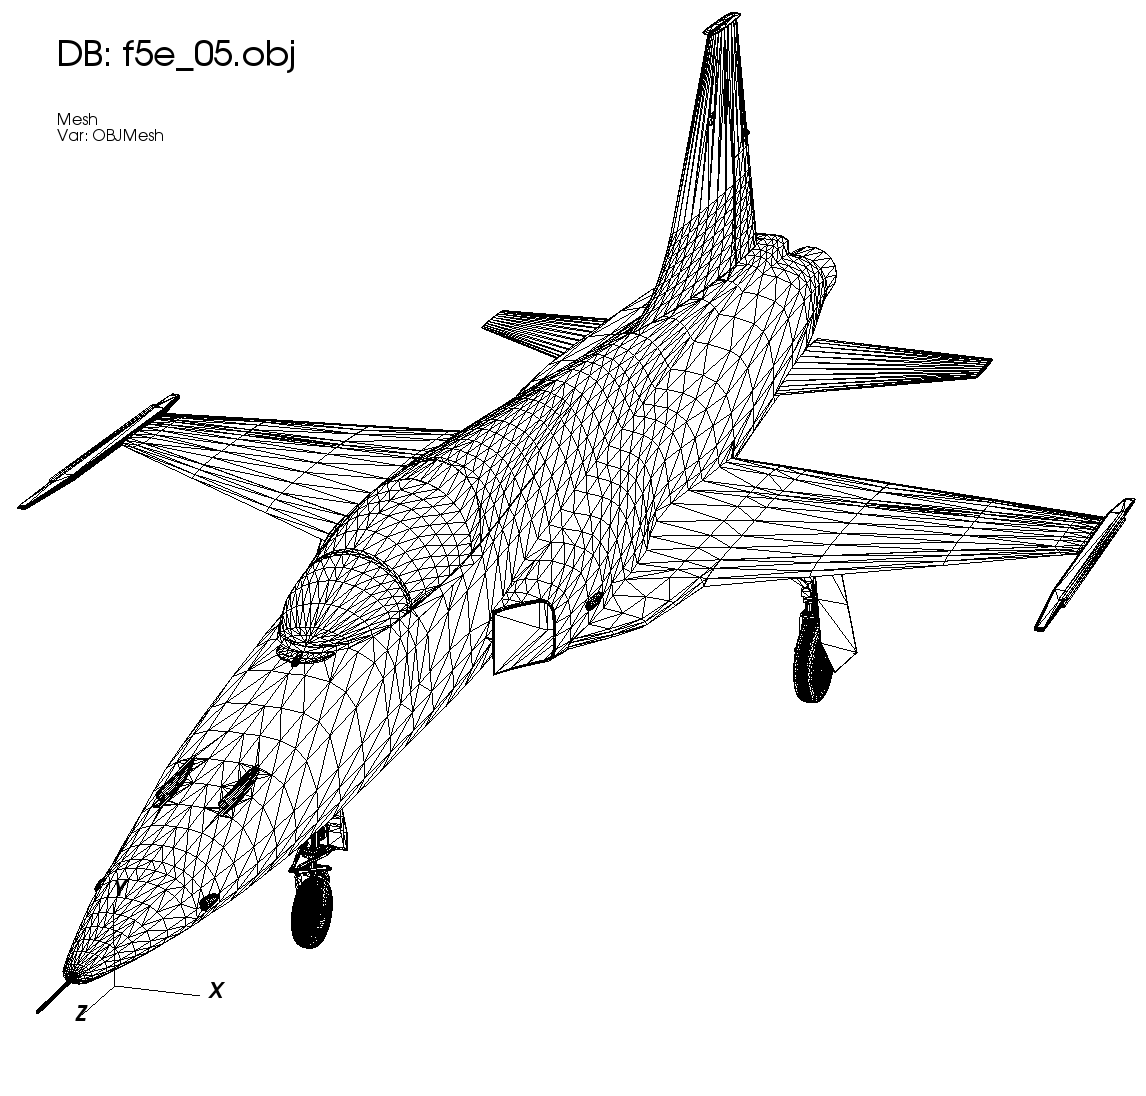
Fig. 3.31 Mesh plot
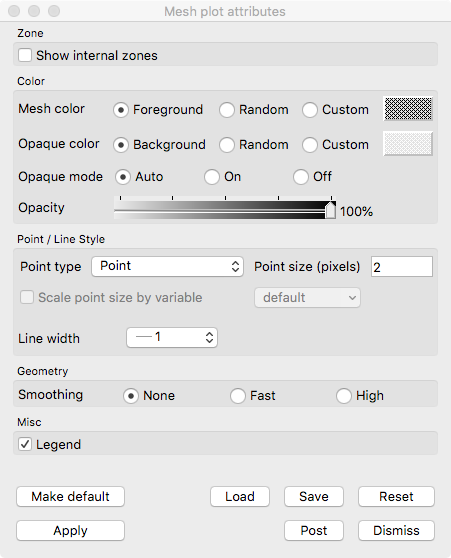
Fig. 3.32 Mesh plot window
3.2.7.1. Mesh plot opaque modes
By default, VisIt’s Mesh plot draws in opaque mode so that hidden surface removal is performed when the plot is drawn and each face of the externally visible cells are outlined with lines. When the Mesh plot’s opaque mode is set to automatic, the Mesh plot will be drawn in opaque mode unless it is forced to share the visualization window with other plots, at which point the Mesh plot is drawn in wireframe mode. When the Mesh plot is drawn in wireframe mode, only the edges of each externally visible cell face are drawn, which prevents the Mesh plot from interfering with the appearance of other plots. In addition to having an automatic opaque mode, the Mesh plot can be forced to be drawn in opaque mode or wireframe mode by clicking the On or Off Radio buttons to the right of the Opaque mode label in the Mesh plot attributes window.
3.2.7.2. Showing internal zones
Sometimes it is useful to create mesh plot that shows all internal zones for a 3D database. Rather then plotting just the externally visible zones, which is the Mesh plot’s default behavior, you can click the Show internal zones check box to force the Mesh plot to draw the edges of every internal zone.
3.2.7.3. Changing colors
There are two color controls for a Mesh plot. One, the mesh color, controls the color of mesh edge lines while the other, the opaque color, controls the color of mesh surface (areal) facets. For each color option, there are three choices
A custom color chosen by the user.
A random color chosen by VisIt.
The Foreground (for mesh lines) or Background (for opaque facets) color.
The default is to use Foreground color for the mesh and Background color for the opaque color. In this mode, when these colors are changed via the Annotation controls, the Mesh plot obeys the newly selected colors. Otherwise, the Mesh plot maintains its chosen color (either custom or random).
The random color option is useful when displaying multiple meshes and the user simply needs to be able to easily distinguish among them.
3.2.7.4. Changing mesh line attributes
The Mesh plot’s mesh lines have two user-settable attributes that control their width and line style. You can set the line width and line style are set by selecting new options from the Line style or Line width menus at the top of the Mesh plot attributes window.
3.2.7.5. Changing point type and size
Controls for points are described in Point type and size.
3.2.7.6. Geometry smoothing
Sometimes visualization operations such as material interface reconstruction can alter mesh surfaces so they are pointy or distorted. The Mesh plot provides an optional Geometry smoothing option to smooth out the mesh surfaces so they look better when the mesh is visualized. Geometry smoothing is not done by default, you must click the Fast or High radio buttons to enable it. The Fast geometry smoothing setting smooths out the geometry a little while the High setting works produces smoother surfaces.