3.2.1. Common Controls
There are a number of attributes of plots that are common to many, if not all plots. These include such things as Color table, Foreground and Background colors, Opacity, Line width and Point type, Log or Linear scaling, the Legend checkbox, the Lighting checkbox and others. These common plot attributes are described here first using the Pseudocolor plot as an example.
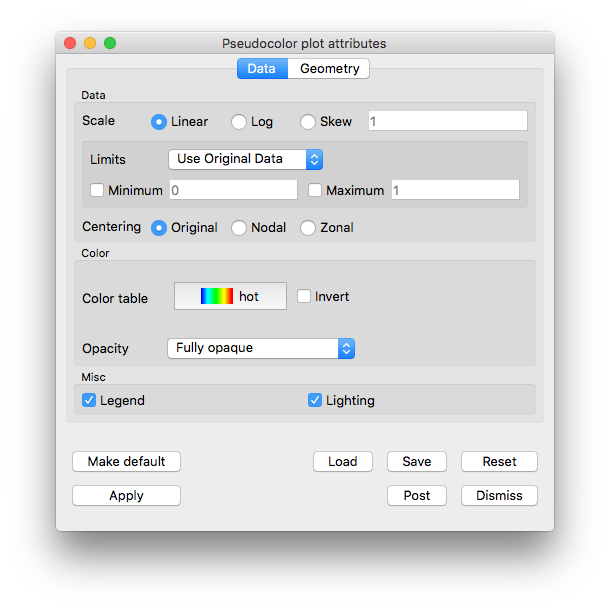
Fig. 3.5 Example of Pseudocolor plot attribute window
Then, attributes specific to each plot type are described in the remaining sections.
3.2.1.2. Plot colors
By default, VisIt uses the Hot color table which maps values at the minimum of the data range to blues, values at the maximum of the data range to reds with transitions from blue to violet, to green, to yellow in between. However, many plots offer the option of selecting a specific color table. In the picture of the Pseudocolor plot attributes window, above, the color table may be changed by selecting the currently named table. A pull-down list will appear from which you can select a different table. For more information about Color tables, see Color Tables.
In addition, many plots have options to control colors and transparency (opacity) of individual plot elements such as lines on the Mesh plot or contours on the Contour plot.
3.2.1.3. Point type and size
The Pseudocolor, Mesh and Scatter plots can use eight different point types for drawing point meshes (see Figure 3.6). The default option of Point is fastest and forces the plot to draw all of its points as tiny points. The Sphere option applies textures to the points so it is nearly as fast as Point. Any of the other options place a glyph at each point, taking longer to render. To set the point type choose an option from the Point type menu. Setting the Point type to anything other than Point will have no effect if the plotted mesh is not a point mesh.
If you choose any of the point types except Point, then you can also specify a point size by typing a new value into the Point size text field. The point size is used to determine the size of the glyph. For example, if you choose Box, and you enter a Point size of 0.1, then the length of all of the edges on the Box glyphs will be 0.1. If you use Point, then the Point size text field becomes the Point size (pixels) text field and you can set the point size in terms of pixels.
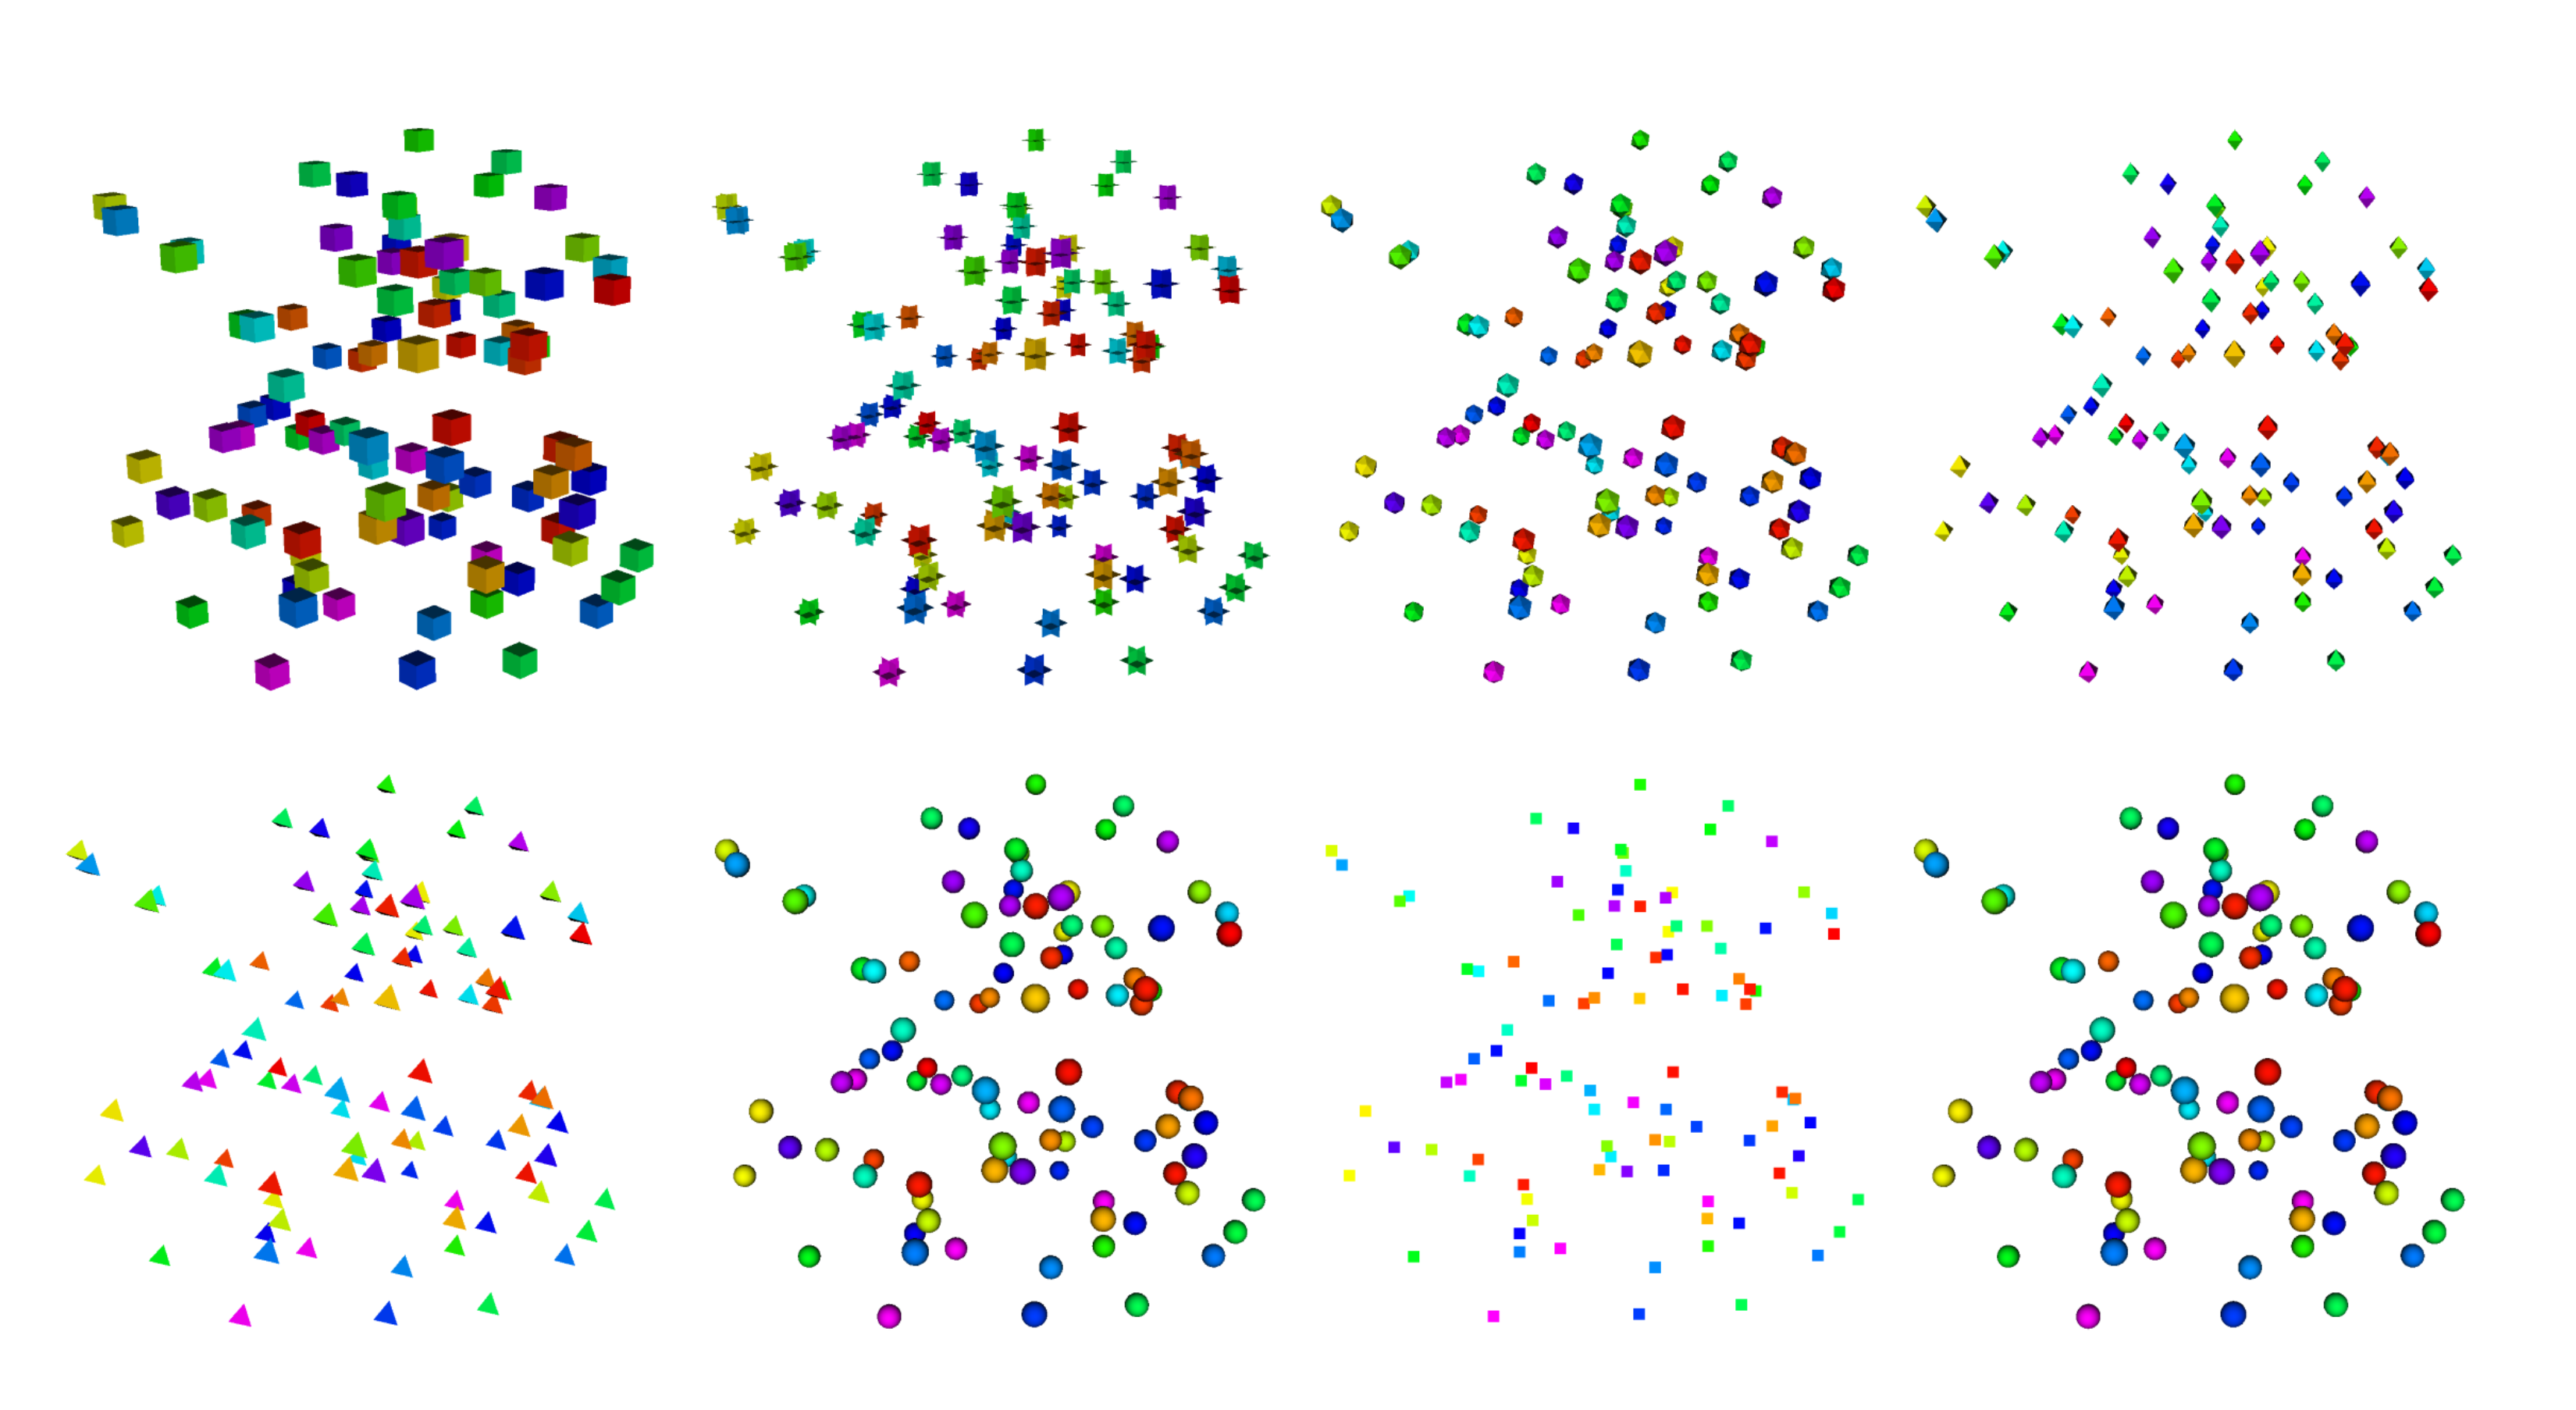
Fig. 3.6 Point types: Box, Axis, Icosahedron, Octahedron, Tetrahedron, Sphere Geometry, Point, Sphere
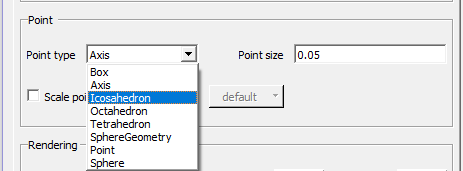
Fig. 3.7 Point type menu, expanded
For Mesh and Pseudocolor plots, the point size can also be scaled by a
scalar variable if you check the Scale point size by variable check box and
select a new scalar variable from the Variable menu. The value default
must be replaced with the name of another scalar variable if you want VisIt to
scale the points with a variable other than the one being plotted.
3.2.1.4. Lighting
Various plots include a Lighting checkbox. When the box is checked, it means the plot will obey all active light sources. When the box is not checked, this does not mean the plot will not be lit at all. Instead, it means that the plot will be lit by Ambient lighting only.