3.2.14. Vector plot
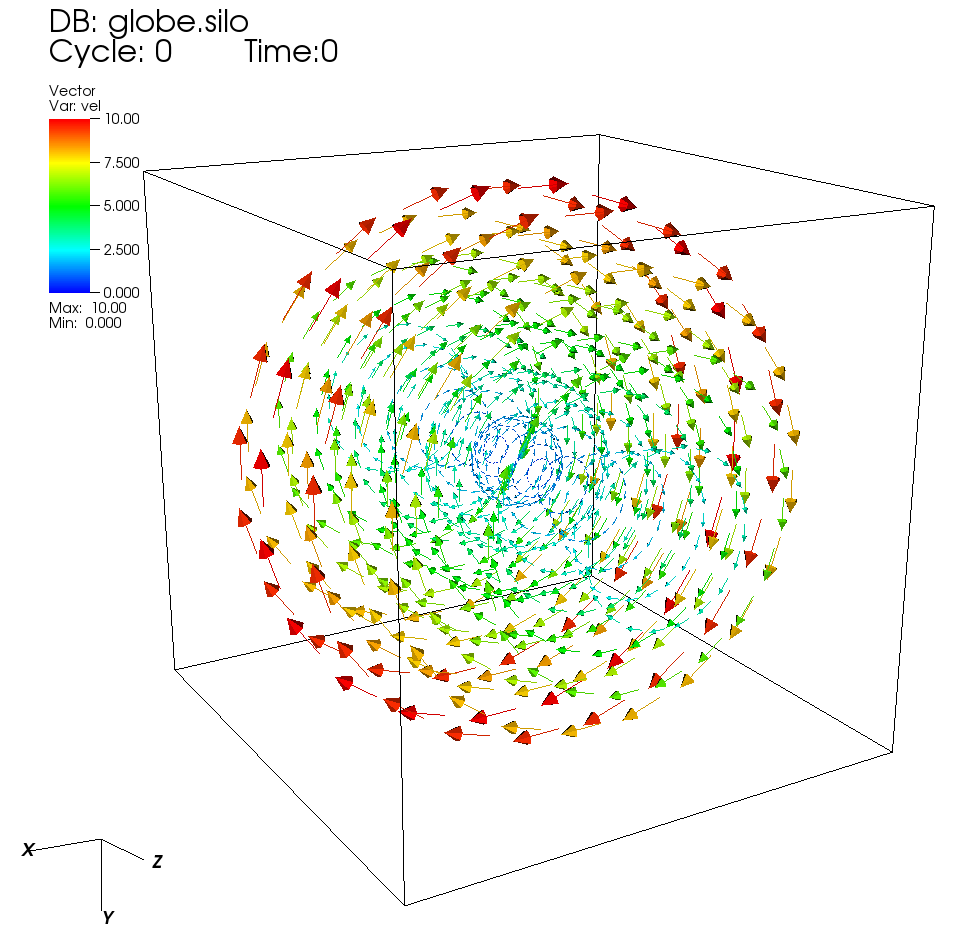
Fig. 3.54 An example vector plot
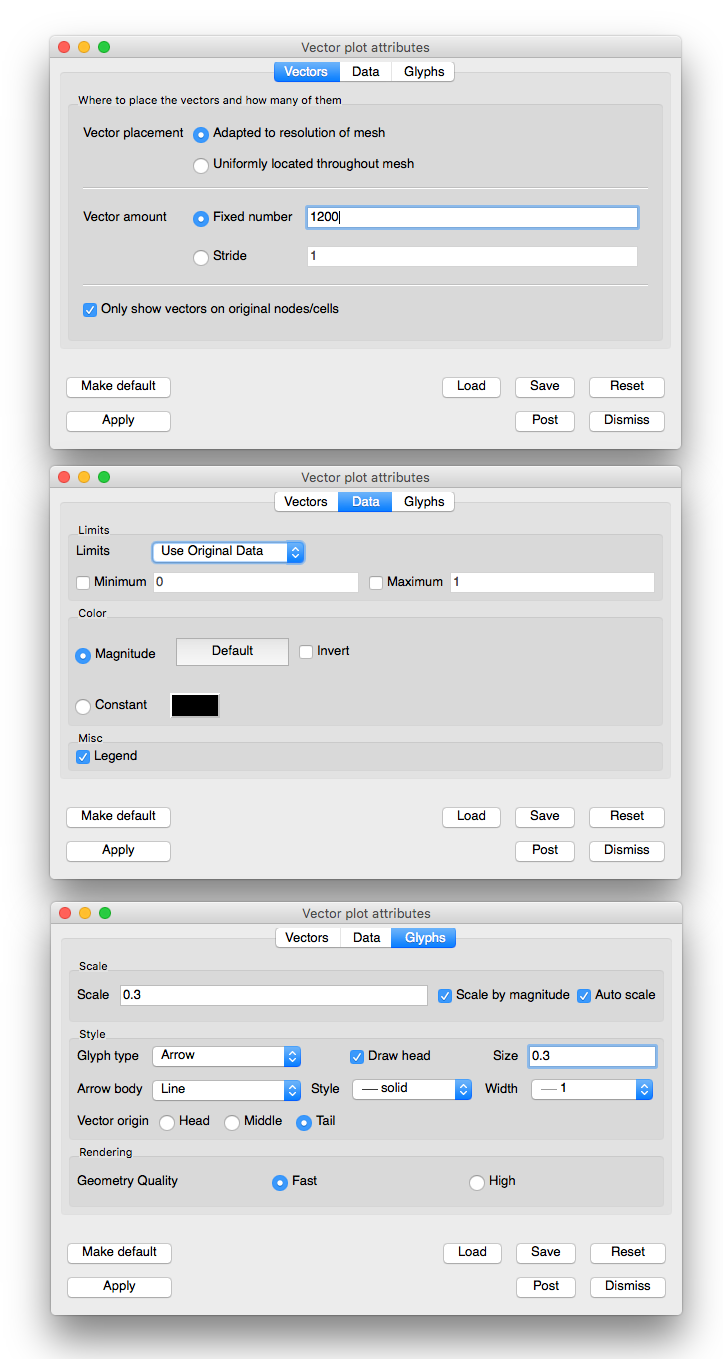
Fig. 3.55 The corresponding Vector plot attributes
The Vector plot (example shown in Figure 3.54) displays vector variables using glyphs that indicate the direction and magnitude of vectors in a vector field.
3.2.14.1. Setting vector color
The vectors in the Vector plot can be colored by the magnitude of the vector variable or they can be colored using a constant color. Choose the coloring method by clicking on either the Magnitude radio button or the Constant color button. When vectors are colored by a constant color, you can change the color by clicking on the color button next to the Constant radio button and choosing a new color from the Popup color menu. When vectors are colored by magnitude, the color is determined by one of VisIt’s color tables, which can be chosen from the Color table button next to the Magnitude radio button.
If you choose to color the vectors by their magnitudes, you have the option of also specifying minimum and maximum values to aid in the mapping of vector magnitude to color. The options that are used to aid coloring are collectively known as limits. Limits can apply to all vectors that exist in the dataset or just the vectors that have been drawn by the Vector plot. To specify which, choose the appropriate option from the Limits combo box. When you specify a minimum value all vectors with magnitudes less than the minimum value are colored using the color at the bottom of the color table. When you specify a maximum value all vectors with magnitudes larger than the maximum value are colored using the color at the top of the color table. To provide a minimum value, check the Min check box and type a new minimum value into the Min text field. To provide a maximum value, check the Max check box and type a new maximum value into the Max text field.
3.2.14.2. Vector scaling
The size of the vector glyphs has a tremendous effect on the Vector plot’s readability. VisIt uses an automatically computed scaling factor based on the diagonal of the bounding box as the size for the largest vector. You can augment this size by entering a new scale factor in to the Scale text field. It is also possible to turn off automatic scaling by turning off the Auto scale check box. When automatic scaling is turned off, the vectors in the Vector plot are the length specified in the Scale text field.
If you want each vector to be further scaled by its own magnitude, you can turn on the Scale by magnitude check box. When the Scale by magnitude check box is off, all vectors are the same length as determined by the automatically computed scale factor and the user-specified scale.
3.2.14.3. Heads on the vector glyph
You can control the vector head size by typing a new value into the Head size text field, which is the fraction of the entire vector’s length that will be devoted to the vector’s head. Vectors in the Vector plot can be drawn without vector heads so that only the line part of the vector glyph is drawn. This results in cleaner plots, but the vector direction is lost. To turn off vector heads, uncheck the Draw head check box at the bottom of the Vector Attributes Window.
3.2.14.4. Tails on the vector glyph
The length of the tails on the vector glyph are determined by the vector scaling factors that have been enabled. You can also set properties that determine the location and line properties used to draw a vector glyph’s tail. First of all, you can set the line style used to draw the vector glyph’s tail by choosing a line style from the Line style combo box. You can choose a new line width for the vector glyph’s tail by choosing a new line width from the Line width combo box. Finally, you can determine where the origin of the vector is on the vector glyph. The vector origin is a point along the length of the vector that is aligned with the node or cell center where the vector glyph will be drawn. The available options are: Head, Middle, and Tail. You can choose a new Vector origin by clicking on one of the Head, Middle, or Tail radio buttons.
3.2.14.5. Setting the number of vectors
When visualizing a large database, a Vector plot will often have too many vectors. The Vector plot becomes incomprehensible with too many vectors. VisIt provides controls to thin the number of vectors to a number that looks appealing in a visualization. You can accomplish this reduction by setting a fixed number of vectors or by setting a stride. To set a fixed number of vectors, select the Fixed vectors radio button and enter a new number of vectors into the corresponding text field. To reduce the number of vectors by setting the stride, select the Stride radio button and enter a new stride value into the Stride text field.