3.2.10. Scatter Plot
The Scatter plot (see Figure 3.44) allows you to combine multiple scalar fields into a point mesh so you can investigate the relationships between multiple input variables. You might, for example, want to see the behavior of pressure vs. density colored by temperature. The Scatter plot can take up to four scalar fields as input and can use up to three of them as coordinates for the created point mesh while one input variable can be used to assign colors to the point mesh. The Scatter plot provides individual controls for setting the limits of each input variable and also allows each input variable to be scaled so that all of the resulting points from disparate data ranges fit in a unit cube.
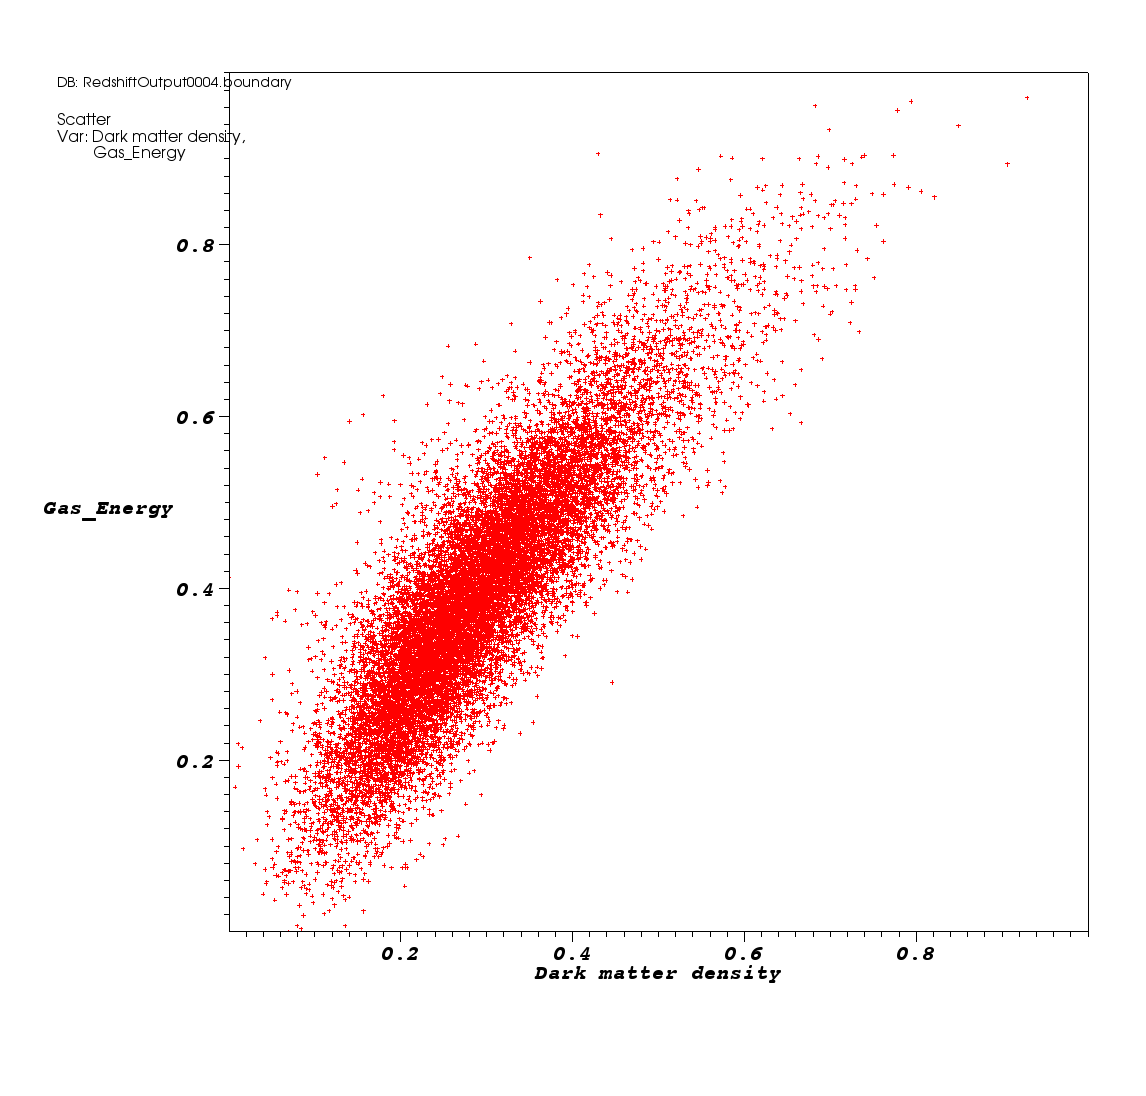
Fig. 3.44 Example of Scatter plot
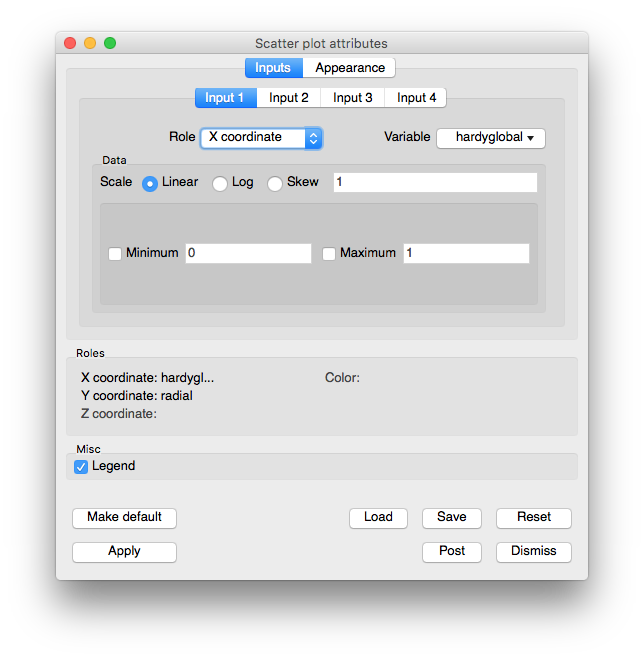
Fig. 3.45 Scatter plot attributes window
The Scatter plot attributes window is divided into two tabs: Inputs and Appearance. The Inputs tab is further subdivided into tabs for each input variable. Each tab for an input variable contains controls that pertain to selecting the input variable, settings its limits, or setting the role that the input variable will perform within the Scatter plot. Each input variable can have one of five roles that will be covered later. The Appearance tab contains controls for changing the Scatter plot’s appearance. Under the two main tabs, the Scatter plot attributes window features a small section that lists the roles that are used in the plot and which input variables are assigned to each role.
3.2.10.1. Scatter plot wizard
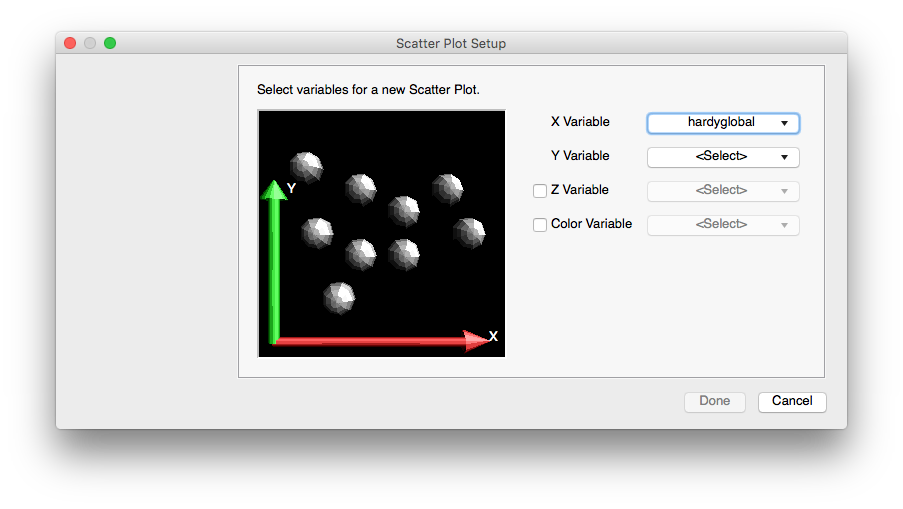
Fig. 3.46 Example of the Scatter plot wizard
Plots are typically created in VisIt when you choose a variable from one of the Plot menus. Since the Scatter plot takes as input up to four input variables and typical plot creation only initializes one variable, you can imagine that if a Scatter plot was created the usual way, only one of its many input variables would be initialized. Furthermore, to initialize the plot, you would have to open the Scatter plot attributes window and select the other variables. Since that would not be a very straightforward way to create a Scatter plot, VisIt now has support for plot wizards. A plot wizard is a simple dialog window that pops up when you select a variable to plot. A plot wizard leads you through a series of questions that allow VisIt to more fully initialize a new plot. The Scatter plot wizard prompts you for the scalar variable to use for the Y-Axis, the variable to use for the Z-Axis (optional), and the variable to use for the plot’s colors (optional).
3.2.10.2. Selecting a variable
Three of the Scatter plot’s four input variables can be set in the Scatter plot attributes window. The first input variable cannot be changed from within the Scatter plot attributes window because that is the default variable used by the plot. If you want to change the first input variable, you can use the Variables menu under the Plot list . If you want to select a different variable for any of the other input variables, you would first click on the input variable’s tab and then you would select a new variable by making a selection from the tab’s Variable button. Note that any combination of nodal and cell-centered variables can be chosen. The Scatter plot will recenter any input variables whose centering does not match the first input variable’s centering.
3.2.10.3. Setting an input variable’s role
Each of the Scatter plot’s input variables has a role that you can set which determines how the input variable is used by the Scatter plot. An input variable can be used for the X, Y, Z coordinates, for the color, or it can have no role. The role of the input variable is not fixed because you might want to change roles many times and it is much less work to change only the roles instead of reselecting variables, limits, and scaling for an input variable. The flexibility of selecting a role for an input variable makes it convenient to turn off colors or the Z coordinate with little effort. To change the role for an input variable, select a new role from the input variable’s Role combo box. If you select a role that is already played by another input variable, VisIt will give the current input variable the selected role and set the input variable that previously had the selected role so that it has no role.
Each of the Scatter plot roles and their associated input variables are listed in the bottom of the Scatter plot attributes window . Roles that have an input variable have the name of the input variable printed next to the name of the role so looking through all of the input variable tabs to determine what the Scatter plot should look like is not required. Roles that have no assigned input variable are grayed out.
3.2.10.4. Setting the minimum and maximum values
The Scatter plot allows you to set minimum and maximum limits on the values considered for inclusion into the created point mesh. If an input variable’s data value does not lie in the specified minimum/maximum value data range then the point is not included in the created point mesh. Note that setting limits does not cause points to be removed when data values in the color role fall outside of the specified limits. To set the minimum value to be allowed in the created point mesh, click on the Min check box and type a new minimum value into the Min text field. To set the maximum value to be allowed in the created point mesh, click on the Max check box and type a new value into the Max text field.
3.2.10.5. Scaling an input variable
Sometimes input variable data values are clustered in a certain range of the data. When this is the case, the points in the Scatter plot will bunch up in one or more dimensions. For more uniformly spaced points, you might try scaling one or more input variables. Each input variable can be scaled in the three common ways: Linear, Log, and Skew. To set the scaling method used for the input variable, click on the Linear, Log, or Skew radio buttons. If you choose the Skew scaling method then you should also enter a value greater than zero into the Skew factor text field to determine the function used for skew scaling.
Since the Scatter plot’s input variables are likely to have wildly different data ranges, the Scatter plot provides an option to independently scale each input variable so it is in the range [0,1] so the resulting plot fits entirely in a cube. If you prefer to see the Scatter plot without this corrective scaling, you can turn off the Scale to cube check box on the Scatter plot attribute window’s Appearance tab.
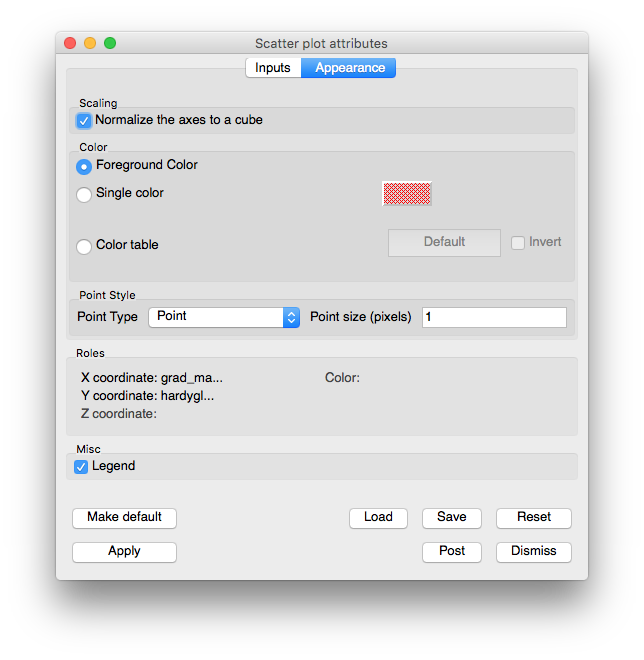
Fig. 3.47 Scatter plot attributes window’s Appearance tab
3.2.10.6. Setting the colors
The Scatter plot can map scalar values to colors like the Pseudocolor plot (Pseudocolor plot) does or it can color all points using a single color. If you have set one of the input variables to have a color role then the Scatter plot will map that input variable’s data values to colors using the specified color table. To change the color table used by the Scatter plot, click on the Color table button and select a new color table from the list of available color tables. If the Scatter plot has been configured such that none of the input variables is playing the color role then the Scatter plot’s points will be drawn using one color. When the Scatter plot draws its points using a single color, its default behavior is to color the points using the vis window’s foreground color. If you want to instead use a different color, turn off the Use foreground check box and click on the Single color color button to select a new color.
3.2.10.7. Setting point properties
Controls for points are described in Point type and size.