1. VisIt Basics
1.2. What you see
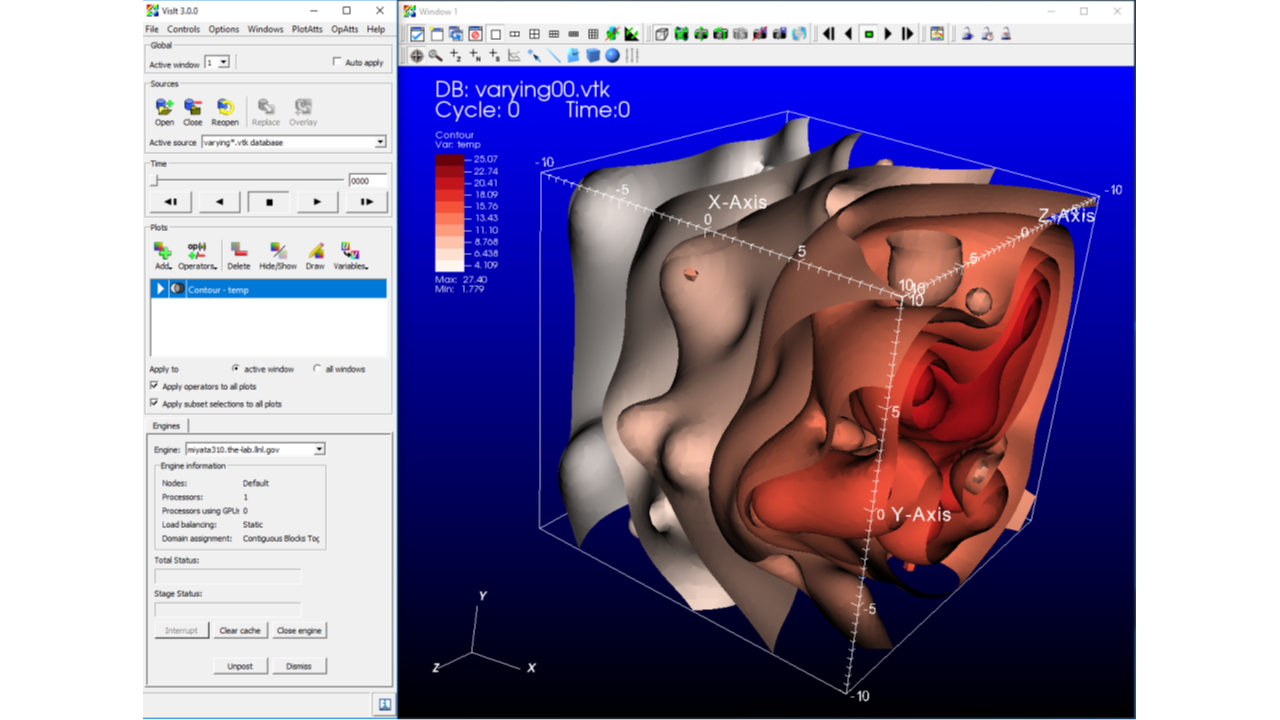
Fig. 1.9 The VisIt graphical user interface and visualization window
The tall grey window on the left is called the Graphical User Interface, which will be refered to from here on as the GUI. It is the primary mechanism for driving VisIt.
The window on the right is called the visualization window. It displays results.
1.3. Opening files
The first thing to do is to open files.
Download the tutorial data folder.
Go to the GUI and click on the Open icon.
This brings up the File open window.
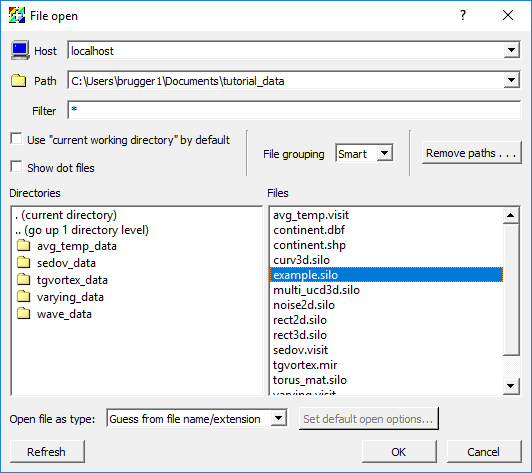
Fig. 1.10 The File open window
Change the Path field to the “tutorial_data” folder.
Highlight the file “example.silo” and then click OK.
You’ve opened a file!
1.3.1. Advanced file opening features
In the File open window:
There is a field for Host. That is how you open a file on another system and run in client/server mode.
There is a Filter. That is provided to subset the file list to only the files VisIt may want.
Example filter: “*.silo *.vtk”
VisIt uses heuristics to determine the file type.
You can explicitly set the file type by setting the Open file as type: to the appropriate type.
You can also open files on the command line. For example,
visit -o file.extopens the file “file.ext”.
1.4. Making a plot
Click on the Add icon to access various plots. This is located about half way down the Main window.
Select Pseudocolor->temp to add a Pseudocolor plot.
After adding a plot, you will see a green entry added to the “Plot list”, which is located half way down the GUI.
This means VisIt will draw this plot after you click Draw.
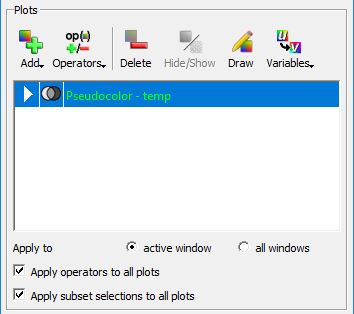
Fig. 1.11 The plot list with a Pseudocolor plot in it
Click Draw.
You should see a plot appear in the visualization window.
Go to Add->Mesh->Mesh.
Click Draw.
You should now see both a Pseudocolor and Mesh plot.
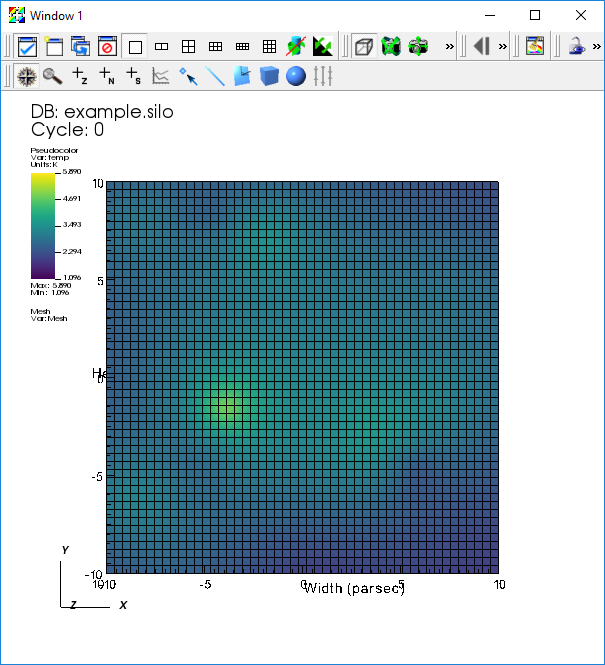
Fig. 1.12 A Pseudocolor and mesh plot displayed in a visualization window
Highlight the Pseudocolor plot in the Plot list.
Click the Hide/Show button.
This will hide the Pseudocolor plot. You should now see only the Mesh plot.
Highlight the Mesh plot and click Delete.
You should now have an empty visualization window.
The Pseudocolor plot should now be selected.
Click Hide/Show.
The Pseudocolor plot should reappear.
1.5. Modifying the plot attributes
Go to PlotAtts->Pseudocolor. This is located in the menu bar at the top of the Main menu.
This brings up the Pseudocolor plot attributes window.
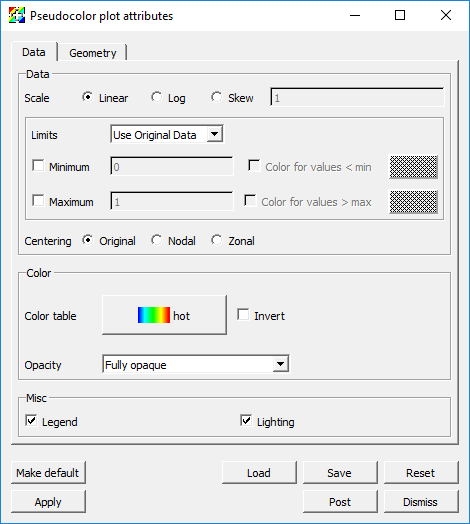
Fig. 1.13 The Pseudocolor plot attributes window
Change the Scale from Linear to Log.
Click Apply.
The colors changed.
Click Minimum on and change the value to “3”.
Click Maximum on and change the value to “4”.
Click Apply.
The colors change again.
Change the Opacity mode to Constant.
Change the opacity slider to 50%.
Click Apply.
You can now see through the plot. Note that you only see the external faces. If you want to see the data from the whole volume, that will be with the volume plot.
Change back the Scale, Limits, and Opacity back to their original settings and click Apply.
Dismiss the Pseudocolor plot attributes window.
1.6. Applying an operator
Click on the Operators button to access various operators. This is located next to the Add button.
Select Slicing->Slice to add a Slice operator.
The visualization window will go blank and the Pseudocolor entry in the Plot list will turn green.
This allows you to change the slice attributes before applying the Slice operator.
We will apply the operator with the default attributes.
Click Draw.
You are now looking at a 2D slice.
Go to OpAtts->Slicing->Slice.
This brings up the Slice operator attributes window.
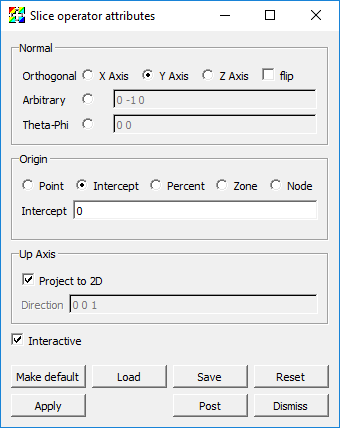
Fig. 1.14 The Slice operator attributes window
There are many controls for setting the slice plane … play with them.
Operators can be removed by clicking on an expansion arrow in the Plot list, then clicking on the red X icon next to an operator.
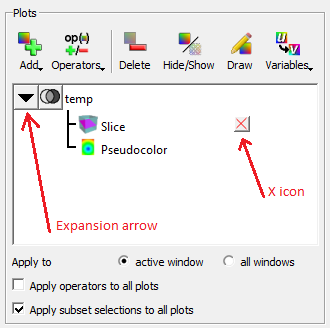
Fig. 1.15 The Expansion arrow and X icon in the Plot list
1.7. VisIt interaction modes
There are six basic interaction modes:
Navigate
Zoom
Zone pick
Node pick
Spreadsheet pick
Lineout
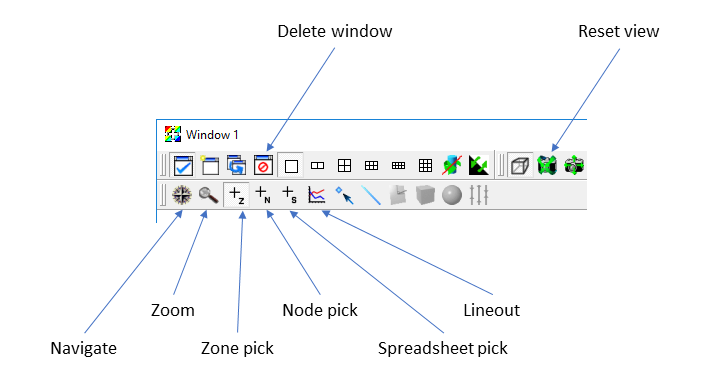
Fig. 1.16 The visualization tool bar with the icons for setting the interaction mode
The interaction mode is controlled by the toolbar, which is located at the top of the visualization window. The six interaction modes are all located together on the toolbar, towards the bottom.
The following descriptions apply to plots of 2D data. Before proceeding:
Select Pseudocolor->temp to add a Pseudocolor plot of temp.
Select Operators->Slicing->Slice to add a Slice operator.
Click Draw.
Click on the Reset view icon in the tool bar to reset the view. It is represented by a camera that has a green “X” around it (The camera is mostly obscured by the X).
1.7.2. Using zoom mode
Zoom mode is indicated by the Zoom icon, represented by a magnifying glass, being indented. It allows you to zoom the image by selecting a rectangular region.
Click on the Zoom icon.
Go to the visualization window and left click (single click) and HOLD IT DOWN.
Move the mouse a bit.
You should see a rubber band.
Lift up the mouse button.
You should now be zoomed in so that the viewport matches what was previously inside the rubber band.
1.7.3. Using lineout mode
Lineout mode is indicated by the Lineout icon, represented by a curve plot of red and blue curves, being indented. It allows the user to create a plot of a scalar variable as a function of distance along a line. Lineout is specific to 2D.
First, reset the view again.
Click on the Lineout icon.
Put the cursor over the data and left click (single click) and HOLD IT DOWN.
Move the mouse a bit.
You should see a single line moving around.
Lift up the mouse button.
A new window will appear. The new window contains a “Lineout”, which has temp as a function of distance over the line.
On the new window, find the Delete window icon, represented by a window with a red circle with a line through it.
Click this button.
The new window will disappear and you should now have only one window.
1.7.4. Using pick mode
Pick mode is indicated by the Zone pick or Node pick icon, represented by a “+” with a small Z or a “+” with a small N, being indented. It allows the user to query a variable associated with a zone or node.
Click on the Zone pick icon.
Put the cursor over the data set and left click (single click).
This brings up the Pick window.
The Pick window contains information about the zone (i.e. cell or element) that you just picked in.
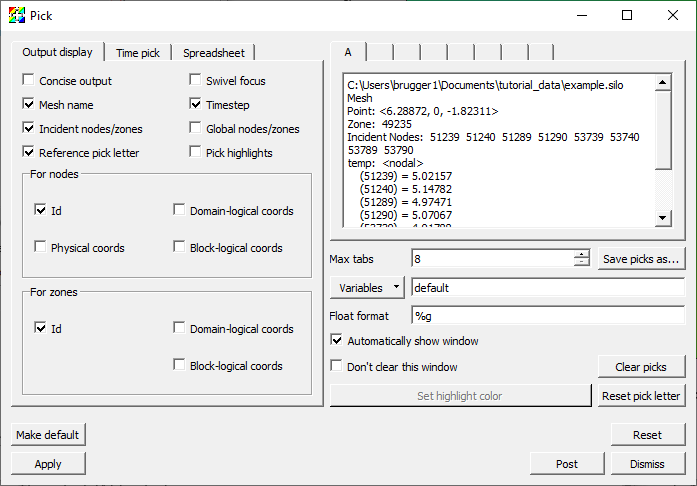
Fig. 1.17 The Pick output window
Pick can return a lot more information than what it just did if you use the Pick window.
Go to the Variables drop down menu and select Scalars/pressure.
Turn on Physical Coords under For Nodes.
Turn on Domain-Logical Coords under For Zones.
Click Apply.
Make another pick.
You get information about pressure, the coordinates of each node, and the logical coordinates for the zone.
1.8. Other plots
We will experiment with the Contour, Filled Boundary, Label, Vector and Volume plots.
1.9. Other operators
We will experiment with the Clip and Threshold operators.
1.10. Saving an image
With a current plot, go to File->Save window.
This saves an image to the filesystem.
On Windows, the default location for saved images is in Documents/VisIt/My images.
1.11. Saving a database
VisIt can be part of a larger tool chain.
If you do not already have one, make a Pseudocolor plot of temp from the “example.silo” database.
Apply the Threshold operator and change the range to be 3->max.
Click Draw.
Go to File->Export database.
This brings up the Export Database window.
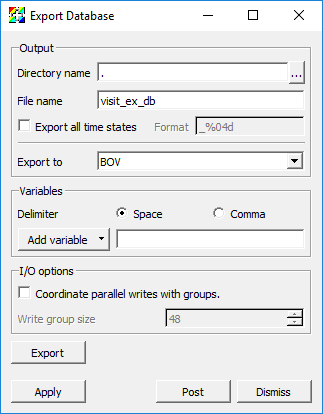
Fig. 1.18 The Export Database window
Change Export to to VTK.
Be sure to set the output directory or the exported file will be written to the working directory (on Windows that would be the directory where VisIt_ is installed).
Click Export.
The Export options for VTK writer window will pop up at this point. It allows you to specify the options for the VTK writer. We will use the default options.
Click Ok.
A file named “visit_ex_db.vtk” has been saved to the file system.
1.12. Subsetting
Delete any plots in your visualization window.
Open the file “multi_ucd3d.silo”.
Make a Subset plot of “domains(mesh1)”.
The plot is colored by “domains”, which normally correspond to a simulation’s processors.
In the Plot list, find the overlapping transparent black and white ovals (like a Venn diagram) and click on it.
This brings up the Subset window.
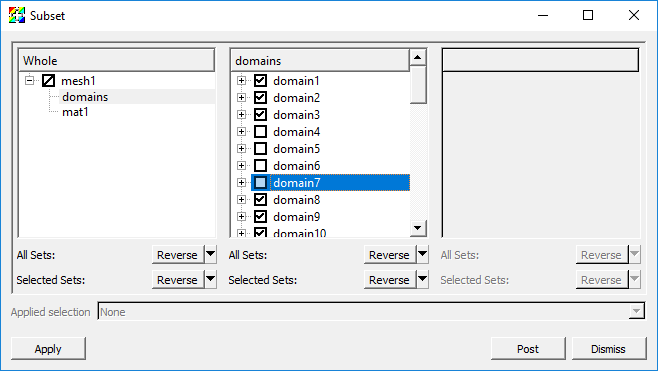
Fig. 1.19 The Subset window
Click on domains in the left most panel.
This will expand the list of domains in the center panel.
Turn off some domains and click Apply.
You will see some of the domains disappear.
Subsetting works with any plot type.
Turn all the domains back on.
Click on mat1 in the left most panel.
This will expand the list of materials in the center panel.
Turn off materials 1 and 3.
You will see material 2 only, colored by domain.
This mechanism is used to expose subsetting for materials, domains, AMR levels, and other custom subsettable parts.